The Bumpy Path to 2H23
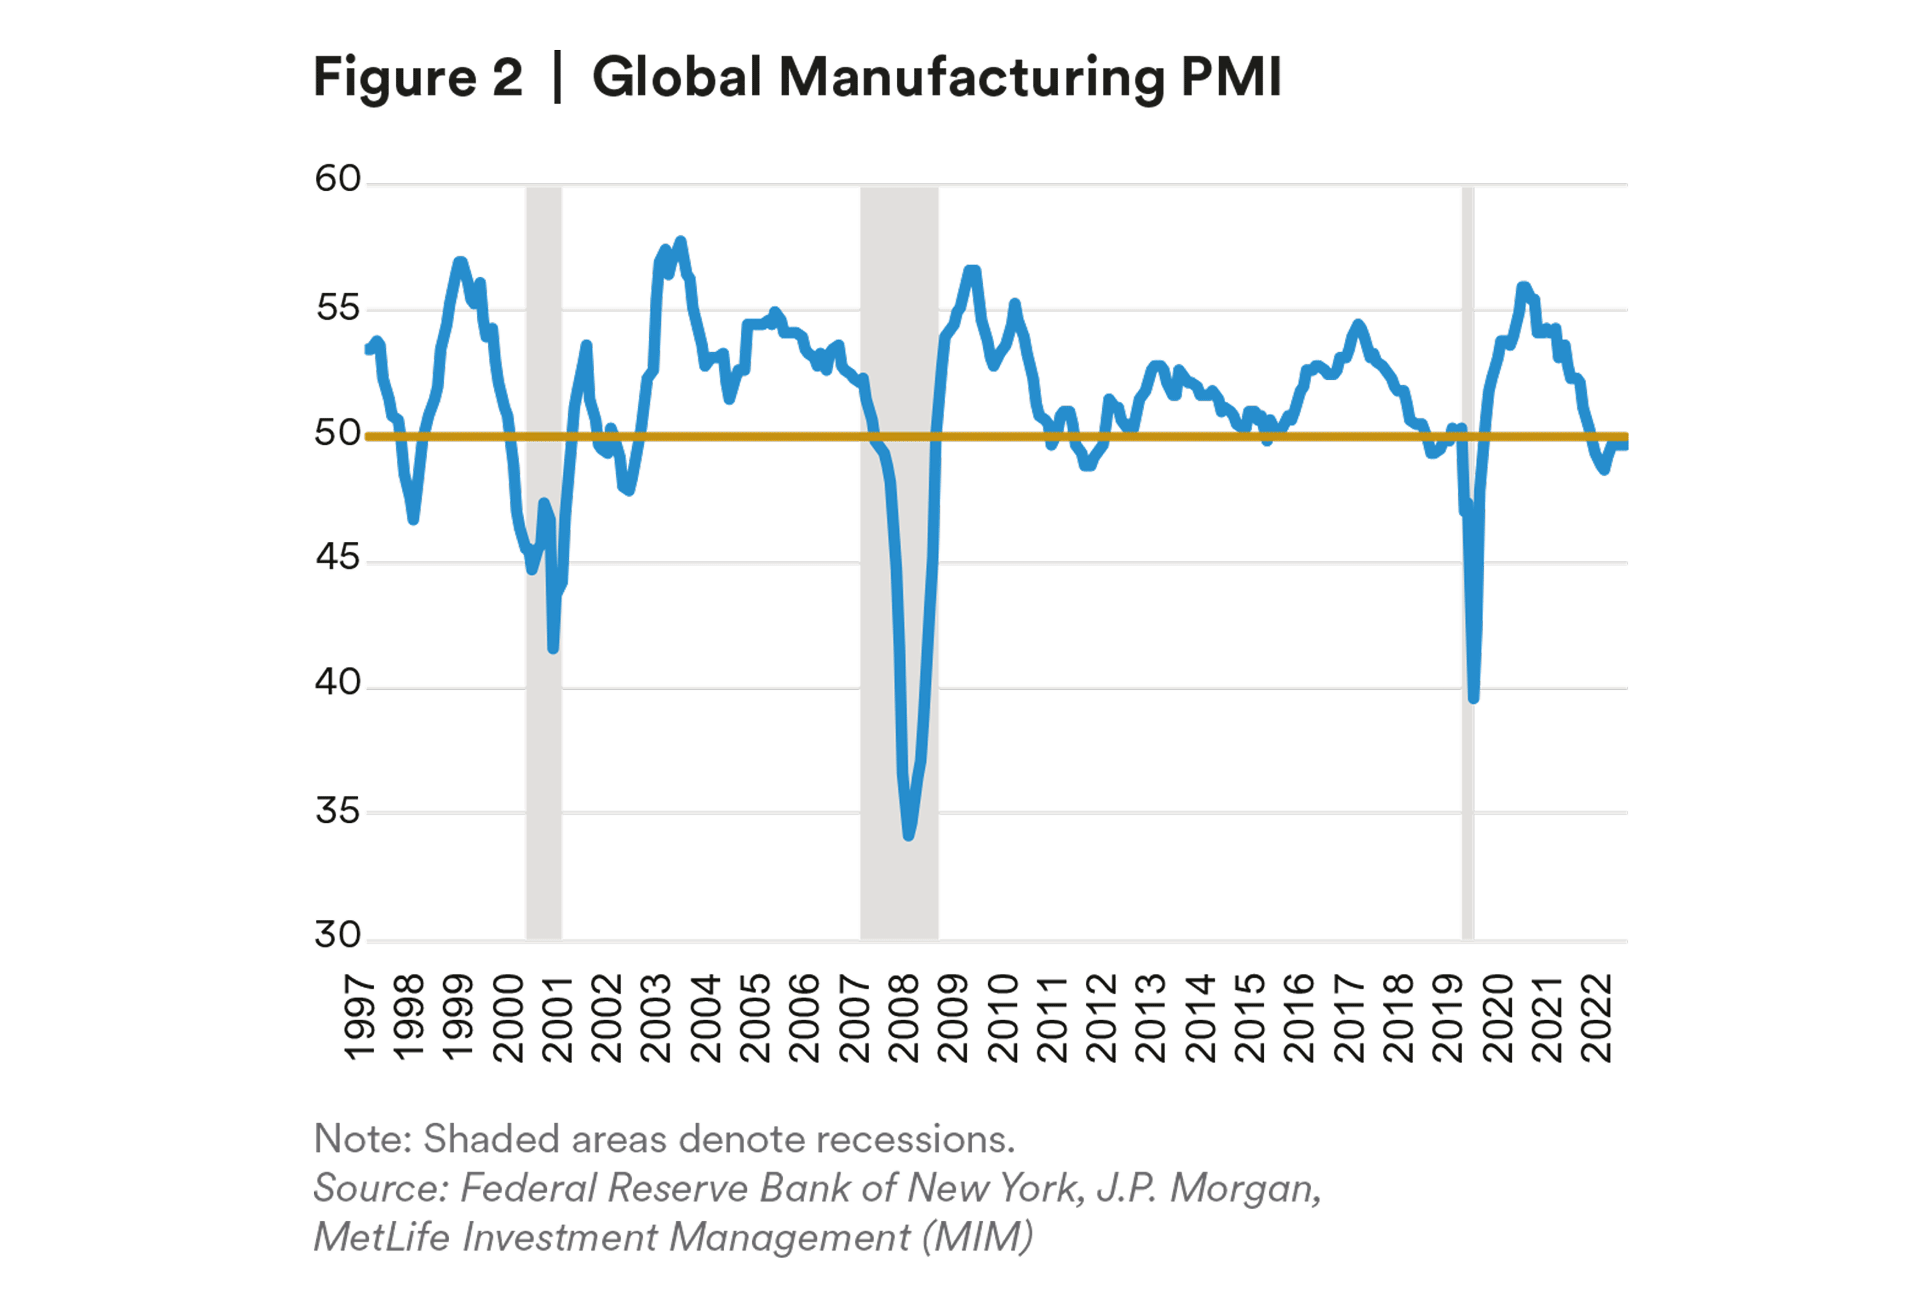
As most central banks are nearing the end of the hiking cycle, JP Morgan’s Global Manufacturing PMI Index remained at a level consistent with a contraction. It was the ninth consecutive month below the neutral level of 50 (see figure 2). U.S. – We continue to expect a recession to begin around midyear and believe that the Fed has likely completed its rate hiking cycle. There is evidence of a slowing in U.S. growth, which we believe signals the beginning of the end of the post-COVID-19 expansion. Europe – Despite the easing of supply constraints, the growth outlook remains subject to several headwinds, including sticky inflation, lagged tightening effects, and softening external demand. Asia – Although the regional growth backdrop has remained resilient, driven by domestic demand (except China), we are anticipating more growth challenges in 2H23. Latin America – Growth remained resilient in 1H23 but may start to lose steam due to monetary policy tightening, weaker commodity prices, and political uncertainty.
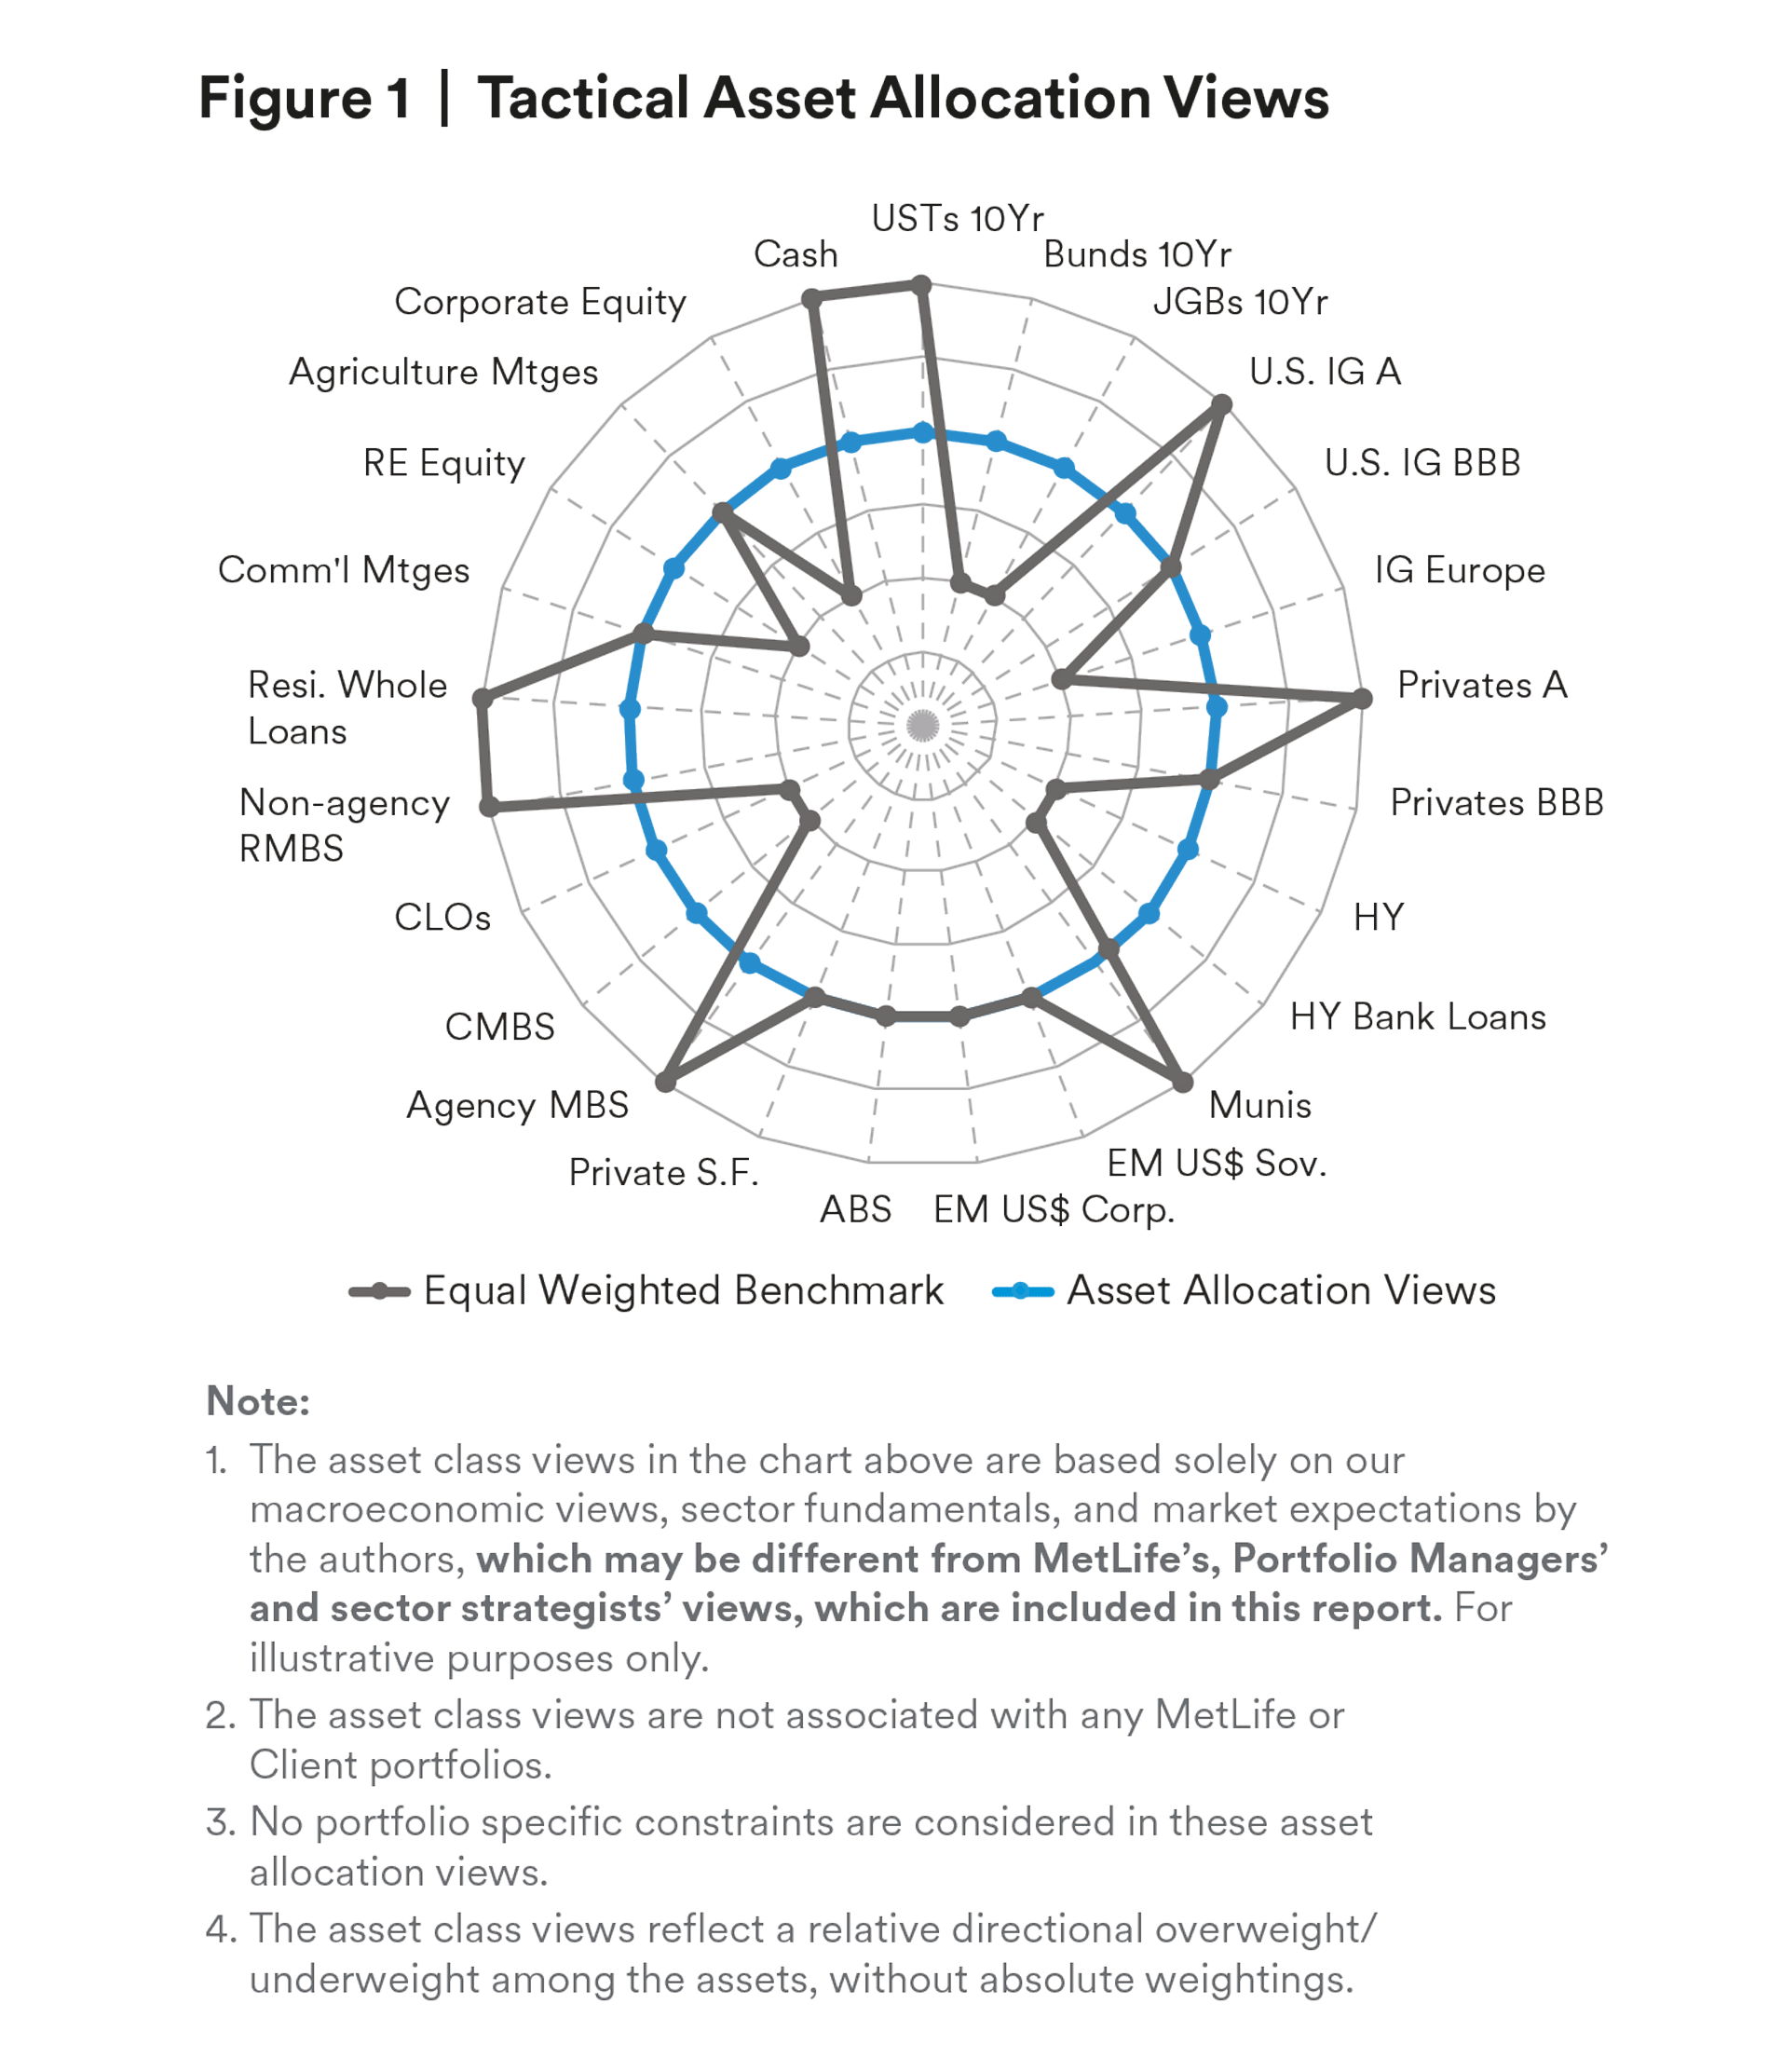
Global Monetary Policy Trends to Diverge
U.S. Treasury – We look for the Fed to cut rates by 0.25% by year-end, and for the 10-year yield to be lower in the coming months. JGBs – We expect the BoJ to widen the band for yield curve control from 0.5% to 1% in the next couple of quarters, and we look for JGB 10-year yields to end the year at around 0.65%. CGBs – China’s slowing growth and low inflation may suppress CGB 10-year yields. Bunds – Valuation looks fair; however, we expect that an accelerated pace of quantitative tightening over the second half of 2023 may lean against any material rally at the longer end in Europe.
The Credit Cycle is Expected to Turn
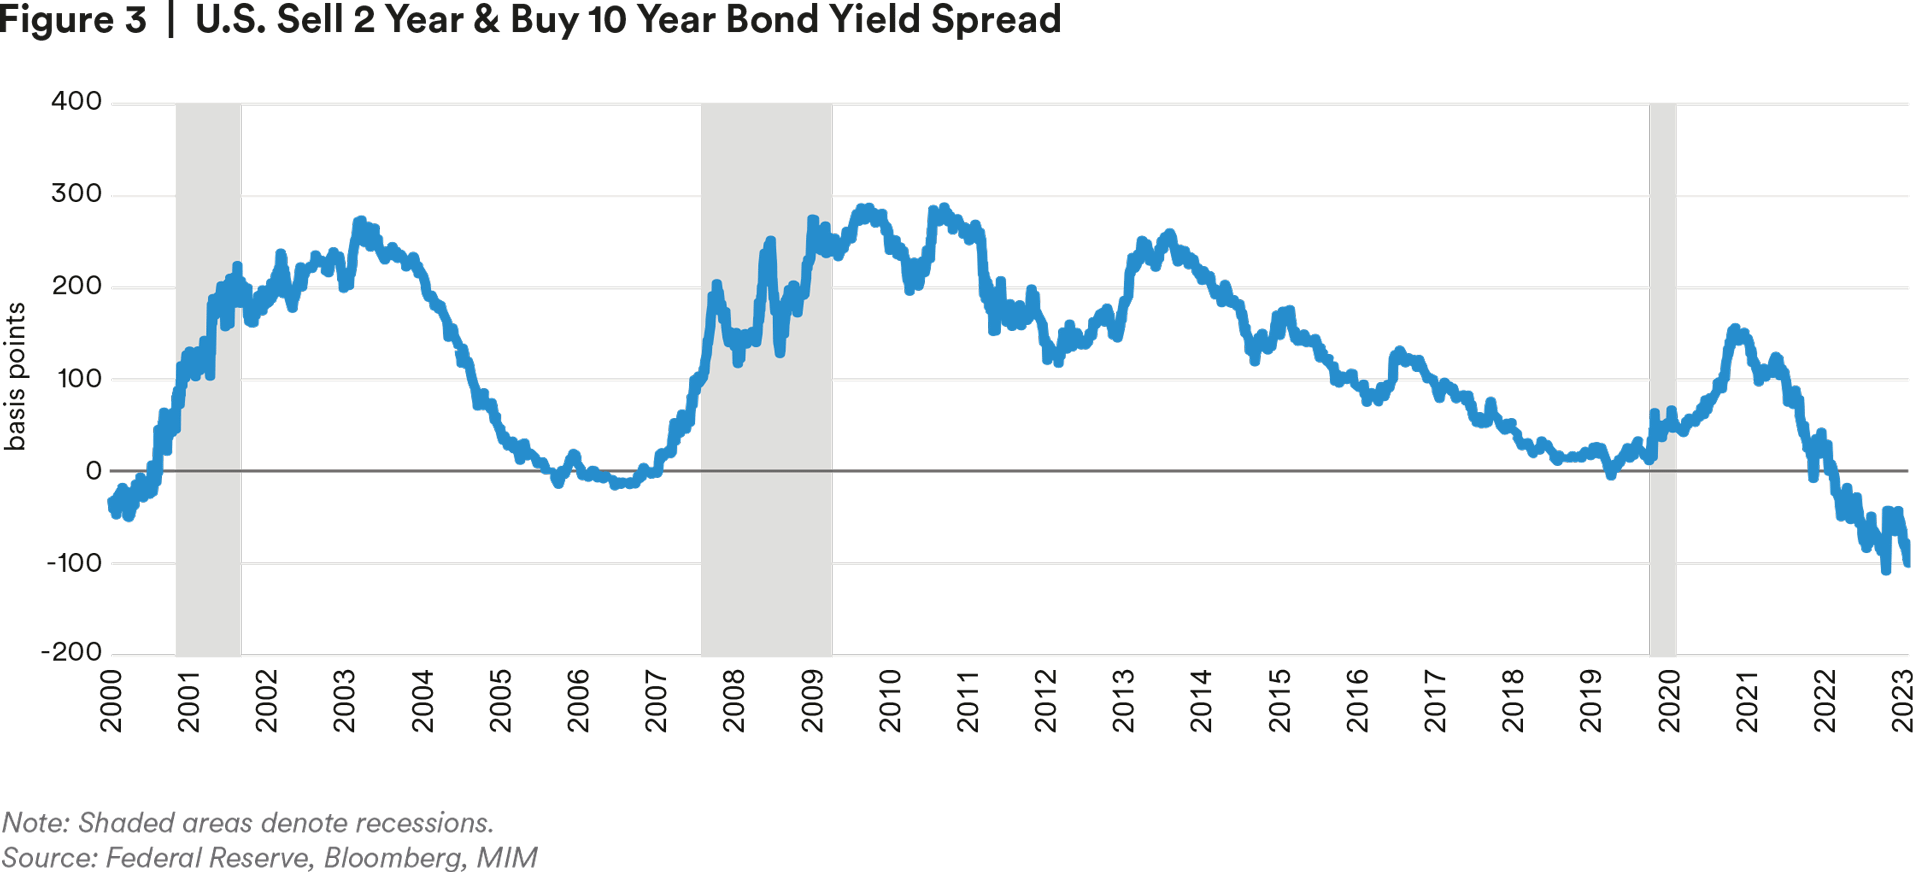
The credit market had a strong recovery following the regional bank turmoil in March. There are good reasons to be optimistic: 1) the policy tightening cycle is nearing an end; 2) the U.S. debt ceiling issue has been resolved; 3) stronger-than-expected earnings in 1Q23 with more optimistic earnings forecasts for 2024; 4) the U.S. economy remains resilient; and 5) the AI boom. However, the momentum is unlikely to be sustained — a deeply inverted yield curve (see figure 3), continued restrictive monetary policy, tightening lending standards, and further credit deterioration are expected in 2H23. Valuations across credit markets are close to historic averages, and pricing appears more like what we should expect mid-cycle. We do not think credit markets have priced in sufficient downside risk yet. Looking forward, the credit cycle is expected to turn in the coming quarters, with spreads widening further on heightened recession risk in 2H23. As a result, we continue to recommend “up-in-quality.” U.S. Investment Grade (IG) – Credit fundamentals weakened marginally in the first quarter as credit metrics deteriorated. The outlook remains neutral on the prospect of further slowing in profits and margin pressures. While overall EBITDA margins are slightly off cycle highs, ex-energy EBITDA margins have already peaked. Overall leverage ratio has only ticked up in 1Q23, but the coverage ratio has deteriorated as interest expenses have risen significantly. IG yields remain near the highest levels since 2009
European IG – Credit fundamentals started to show signs of weakening in 1Q23 as the leverage ratio ticked up for the first time since the pandemic. Despite the announced OPEC cuts, oil prices are materially below the 2Q22 levels. EBITDA growth and margins are anticipated to continue trending down in the coming quarters. Although the ECB slowed down its pace of rate hikes, we are concerned that the eurozone growth may be below potential due to numerous headwinds. Nevertheless, the ECB is expected to conduct further rate hikes. High Yield – Credit fundamentals showed early signs of weakening. While the leverage ratio improved marginally in the first quarter, the coverage ratio ticked lower as interest expense outpaced EBITDA growth. According to JP Morgan, defaults picked up in 2022 and continued into 2023 but remain benign. Moody’s expects the U.S. default rate to rise to 5.6% by May 2024 from only 3.1% in May 2023. The bond recovery rate dropped below its five-year average. Leveraged Loans – Due to the prevalence of loan-only capital structures, recovery rates are meaningfully lower than historical averages. Although recovery rates for first-lien loans remain above their
five-year average in May 2023, according to Moody’s, recovery rates for loan-only issuers over the past 12 months are significantly lower than those for cross issuers. Downgrades outnumbered upgrades in May, indicating that the rating migration has been negative for 13 months. Spreads appear attractive, but we are concerned about higher defaults with lower recovery rates and heightened downgrade risk for leveraged loans in 2023. Municipals – Outlooks for general obligation (GO) and revenue bonds remain sound despite a challenging macro outlook. For GOs, total state and local government tax revenue declined 2.3% year-over-year in 4Q22, according to the Treasury Department. This is a sharp contrast to the gains seen in 2H22. Coincident indexes improved in 1Q23. Budget reserves for FY2023 remain strong despite slowing revenue growth. For revenue bonds, air traffic has recovered from the 2020 lows, and toll road revenues have largely recovered to pre-pandemic levels. In the healthcare sector, the Omicron surge had a more severe financial impact on not-for-profit hospitals due to the nursing shortage. Recovery in EBITDA margins is expected to occur slowly in 2023-24, due to improving
productivity, cost reductions, and higher revenues. Emerging Market (EM) IG – After a strong rebound in 1Q23, we expect EM growth to moderate to below trend in 2H23. In China, the recovery is uneven as service sector activity continues to outperform, while the manufacturing sector has slowed significantly. China’s central bank unexpectedly cut its short-term policy rate, and officials are considering a broad package of stimulus to support the property sector and domestic demand. For EM corporates, the outlook remains neutral as quarterly revenues and EBITDA declined slightly. EBITDA margins contracted but are still near the cycle peak. We expect margins to remain healthy, although there is the possibility of compression due to higher cost pressures. The leverage ratio continued to pick up as LTM EBITDA deteriorated marginally, even as debt levels were stable.
Housing Fundamentals Remain Resilient
Although lending conditions are tightening, weaker performance has been contained and within longterm expectations. Residential Credit – Thanks to low transactions and high mortgage rates that discourage existing borrowers (who have locked in at a lower rate) from swapping their houses, housing supply has been persistently tight, helping to limit downside to prices.
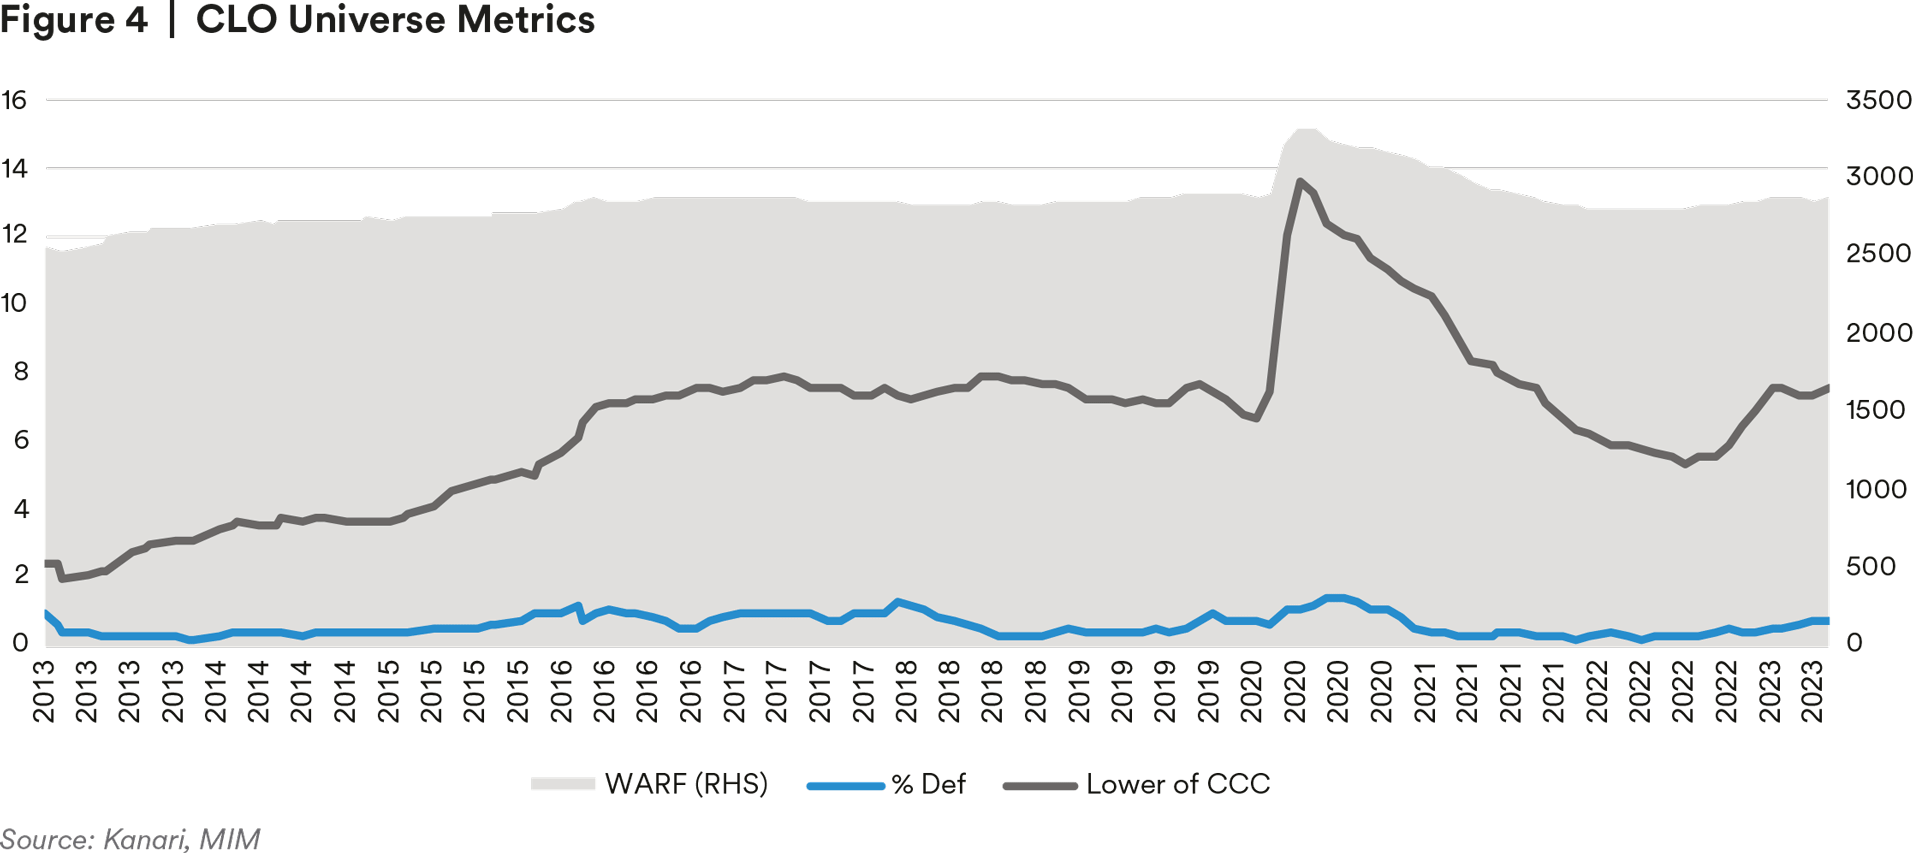
A recent JP Morgan analysis pointed out that “60% of builders raised prices in May, 34% held prices flat, and just 6% lowered prices.” Asset-backed Securities (ABS) – The still-robust labor market and healthy consumer balance sheets have been underpinning consumer spending. As the economy slips into a mild recession, a pullback in consumer health is widely expected, but it has not materialized in any significant manner and has been slow in progression. Currently, we are seeing that only the weakest consumers — those with low savings and high borrowing rates — are showing stress, and that stress is confined to certain sectors. The Federal Reserve’s delinquency rate on all consumer loans rose to 2.23% in Q1, though this is still lower than the pre-pandemic level of 2.31%. Collateralized Loan Obligations (CLO) – As we endure an elevated downgrade environment, we have noticed that the share of CCC within CLO portfolios has grown, and defaults are trending higher (see figure 4). Deal weighted-average risk factors, or WARFs, are increasing slowly. Issuance has begun to slow after a brisk Q1. Recovery rates have been under pressure lately and have fallen to multi-year lows according to JP Morgan. In our view, it is expected that 40% of CLOs will be out of reinvest by year-end, which may reduce the flexibility of CLO managers to manage their pools Commercial Mortgage-backed Securities (CMBS) – Fundamentals continue to face several challenges: tighter lending standards, higher refinancing costs, elevated volatility in the capital markets, and valuations under pressure. Elevated office vacancy across the U.S. is leading to growing delinquencies in office collateral. With weak demand for office space, we may see the effects of lower tenant demand on the sector, when leases on office properties begin to roll. Rating agencies are expected to become more active with downgrades and negative watches in the near future. Agency MBS – With attractive valuations, a diminishing negative convexity effect, and the potential decline of interest rate volatility, money managers are increasingly overweight on Agency MBS. However, bank liquidations and a weak outlook for bank demand may pressure the sector. We noticed that mortgage originations have normalized this spring, as positive seasonals offset higher mortgage rates. Refinancing activity remains minimal as the majority of the asset universe is out of the money. Private Structured Credit – With high rates, inflation pressures, and potential weakness in employment, we expect delinquencies and defaults to rise in the coming months., This is especially true for asset classes exposed to non-prime borrowers. The private ABS pipeline has slowed as market volatility increased. Credit stress and rising recession risk put pressure on spreads. We expect esoteric ABS spreads to remain under pressure in Q3 and may see potential spread widening.
Office is the Most Stressed Sector
Despite economic headwinds, we think current commercial real estate fundamentals remain generally healthy. Most property types are well positioned, with vacancy rates at or below their historical averages. However, in our view, office is the most stressed sector.
Positive Drivers may Offset Recent Signs of Softening
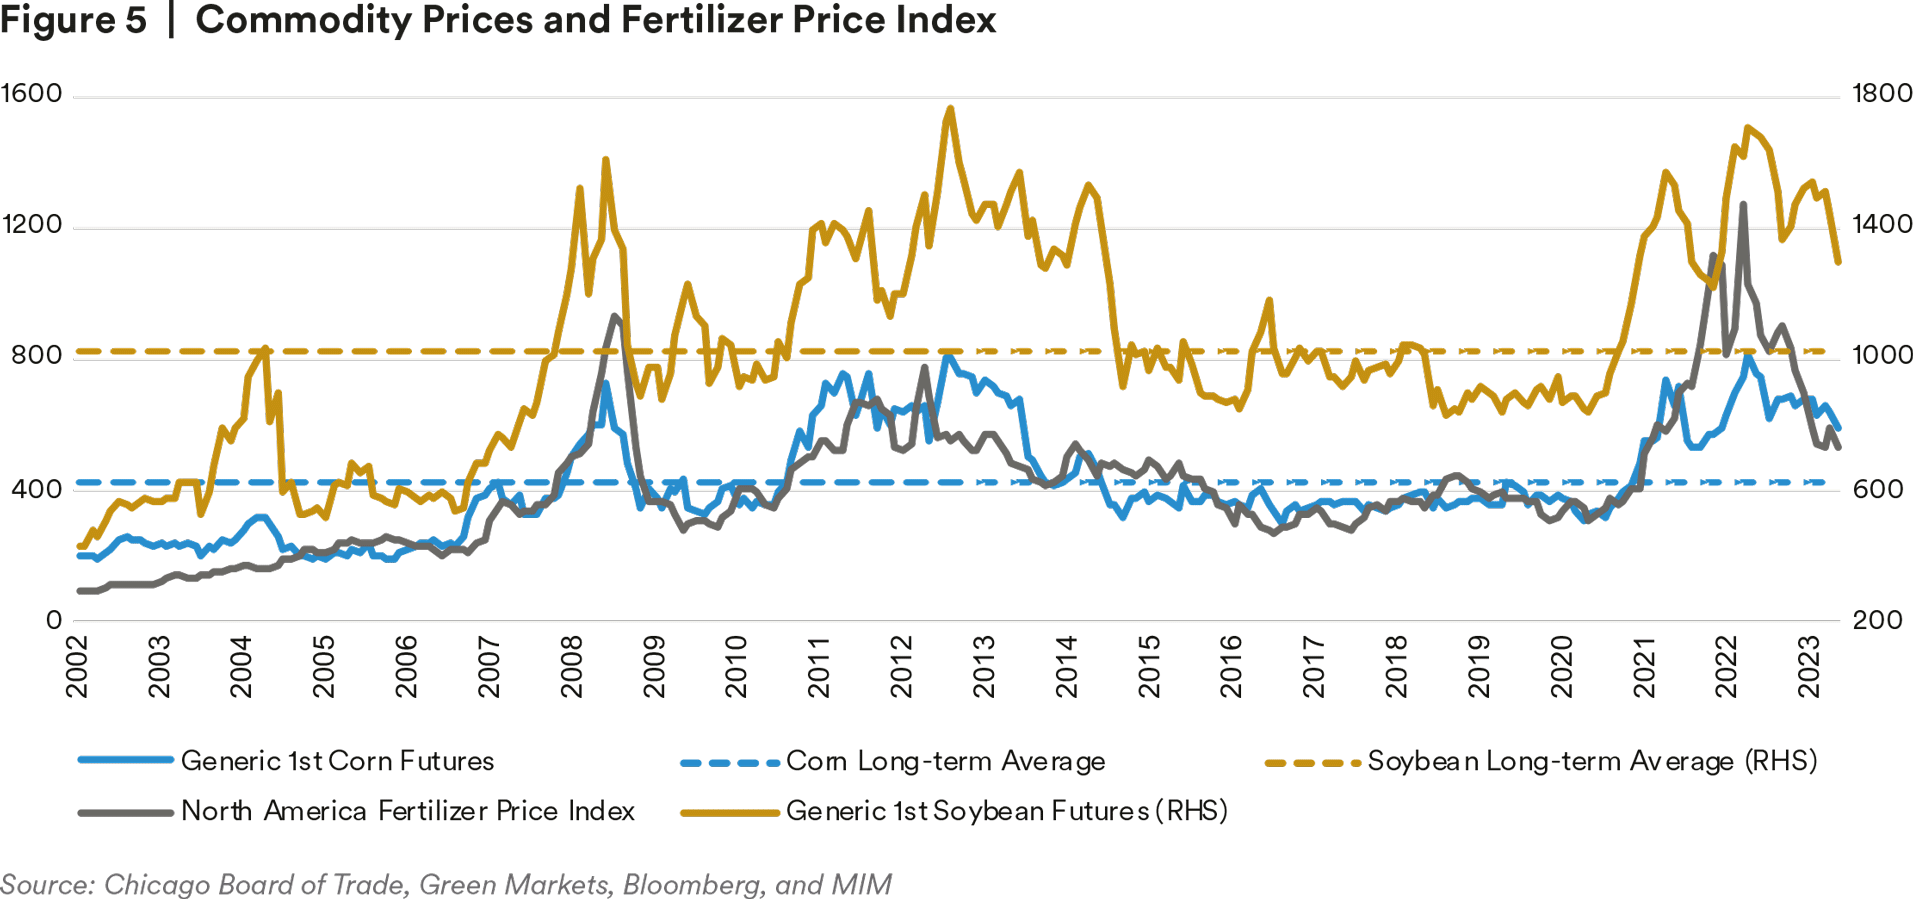
Due to the ongoing Ukraine-Russia conflict, softening economic conditions, policy tightening, and a stronger U.S. dollar, U.S. agricultural exports are expected to decrease from last year’s record high. Despite these headwinds, agricultural credit fundamentals remain robust, thanks to above-average commodity prices and moderating input costs, such as fertilizer (see figure 5). South American crop production has improved slightly compared to spring projections due to easing drought conditions. As a result, global corn and soybean production are expected to expand in 2023. However, tight stocks may keep crop prices above the 10-year average and support margins this year. We continue to believe farm sector financials remain healthy, with near-record farmland values, strong farm incomes, and historically low delinquency rates on agricultural mortgages.
Corporate Equity May Lose Steam While Cash Seems Attractive
Since the regional bank turmoil in the spring, equity markets have posted a surprisingly good performance so far this year, reflecting better-than-expected macro news flow. However, we believe that this is unlikely to be sustained due to the inversion of the yield curve, ongoing policy tightening, compressing margins, a slowdown in earnings, and elevated recession risks. We look for U.S. corporate equity to start to lose steam as the economy enters a recession around midyear. We remain underweight corporate equity from a relative value perspective. Cash seems relatively attractive, with U.S. three-month Treasury bills yielding above 5%, according to Bloomberg. As monetary policy will likely remain restrictive in the near future, cash may maintain its relative attractiveness.
Disclosure
This material is intended solely for Institutional Investors, Qualified Investors and Professional Investors. This analysis is not intended for distribution with Retail Investors.
This document has been prepared by MetLife Investment Management (“MIM”)1 solely for informational purposes and does not constitute a recommendation regarding any investments or the provision of any investment advice, or constitute or form part of any advertisement of, offer for sale or subscription of, solicitation or invitation of any offer or recommendation to purchase or subscribe for any securities or investment advisory services. The views expressed herein are solely those of MIM and do not necessarily reflect, nor are they necessarily consistent with, the views held by, or the forecasts utilized by, the entities within the MetLife enterprise that provide insurance products, annuities and employee benefit programs. The information and opinions presented or contained in this document are provided as of the date it was written. It should be understood that subsequent developments may materially affect the information contained in this document, which none of MIM, its affiliates, advisors or representatives are under an obligation to update, revise or affirm. It is not MIM’s intention to provide, and you may not rely on this document as providing, a recommendation with respect to any particular investment strategy or investment. Affiliates of MIM may perform services for, solicit business from, hold long or short positions in, or otherwise be interested in the investments (including derivatives) of any company mentioned herein. This document may contain forward-looking statements, as well as predictions, projections and forecasts of the economy or economic trends of the markets, which are not necessarily indicative of the future. Any or all forward-looking statements, as well as those included in any other material discussed at the presentation, may turn out to be wrong.
All investments involve risks including the potential for loss of principle and past performance does not guarantee similar future results. Property is a specialist sector that may be less liquid and produce more volatile performance than an investment in other investment sectors. The value of capital and income will fluctuate as property values and rental income rise and fall. The valuation of property is generally a matter of the valuers’ opinion rather than fact. The amount raised when a property is sold may be less than the valuation. Furthermore, certain investments in mortgages, real estate or non-publicly traded securities and private debt instruments have a limited number of potential purchasers and sellers. This factor may have the effect of limiting the availability of these investments for purchase and may also limit the ability to sell such investments at their fair market value in response to changes in the economy or the financial markets
In the U.S. this document is communicated by MetLife Investment Management, LLC (MIM, LLC), a U.S. Securities Exchange Commission registered investment adviser. MIM, LLC is a subsidiary of MetLife, Inc. and part of MetLife Investment Management. Registration with the SEC does not imply a certain level of skill or that the SEC has endorsed the investment advisor.
This document is being distributed by MetLife Investment Management Limited (“MIML”), authorised and regulated by the UK Financial Conduct Authority (FCA reference number 623761), registered address 1 Angel Lane, 8th Floor, London, EC4R 3AB, United Kingdom. This document is approved by MIML as a financial promotion for distribution in the UK. This document is only intended for, and may only be distributed to, investors in the UK and EEA who qualify as a “professional client” as defined under the Markets in Financial Instruments Directive (2014/65/EU), as implemented in the relevant EEA jurisdiction, and the retained EU law version of the same in the UK.
For investors in the Middle East: This document is directed at and intended for institutional investors (as such term is defined in the various jurisdictions) only. The recipient of this document acknowledges that (1) no regulator or governmental authority in the Gulf Cooperation Council (“GCC”) or the Middle East has reviewed or approved this document or the substance contained within it, (2) this document is not for general circulation in the GCC or the Middle East and is provided on a confidential basis to the addressee only, (3) MetLife Investment Management is not licensed or regulated by any regulatory or governmental authority in the Middle East or the GCC, and (4) this document does not constitute or form part of any investment advice or solicitation of investment products in the GCC or Middle East or in any jurisdiction in which the provision of investment advice or any solicitation would be unlawful under the securities laws of such jurisdiction (and this document is therefore not construed as such).
For investors in Japan: This document is being distributed by MetLife Asset Management Corp. (Japan) (“MAM”), 1-3 Kioicho, Chiyoda-ku, Tokyo 102-0094, Tokyo Garden Terrace KioiCho Kioi Tower 25F, a registered Financial Instruments Business Operator (“FIBO”) under the registration entry Director General of the Kanto Local Finance Bureau (FIBO) No. 2414.
For Investors in Hong Kong S.A.R.: This document is being issued by MetLife Investments Asia Limited (“MIAL”), a part of MIM, and it has not been reviewed by the Securities and Futures Commission of Hong Kong (“SFC”). MIAL is licensed by the Securities and Futures Commission for Type 1 (dealing in securities), Type 4 (advising on securities) and Type 9 (asset management) regulated activities.
For investors in Australia: This information is distributed by MIM LLC and is intended for “wholesale clients” as defined in section 761G of the Corporations Act 2001 (Cth) (the Act). MIM LLC exempt from the requirement to hold an Australian financial services license under the Act in respect of the financial services it provides to Australian clients. MIM LLC is regulated by the SEC under US law, which is different from Australian law.
MIMEL: For investors in the EEA, this document is being distributed by MetLife Investment Management Europe Limited (“MIMEL”), authorised and regulated by the Central Bank of Ireland (registered number: C451684), registered address 20 on Hatch, Lower Hatch Street, Dublin 2, Ireland. This document is approved by MIMEL as marketing communications for the purposes of the EU Directive 2014/65/EU on markets in financial instruments (“MiFID II”). Where MIMEL does not have an applicable cross-border licence, this document is only intended for, and may only be distributed on request to, investors in the EEA who qualify as a “professional client” as defined under MiFID II, as implemented in the relevant EEA jurisdiction. The investment strategies described herein are directly managed by delegate investment manager affiliates of MIMEL. Unless otherwise stated, none of the authors of this article, interviewees or referenced individuals are directly contracted with MIMEL or are regulated in Ireland. Unless otherwise stated, any industry awards referenced herein relate to the awards of affiliates of MIMEL and not to awards of MIMEL.
1 As of March 31, 2023, subsidiaries of MetLife, Inc. that provide investment management services to MetLife’s general account, separate accounts and/or unaffiliated/ third party investors include Metropolitan Life Insurance Company, MetLife Investment Management, LLC, MetLife Investment Management Limited, MetLife Investments Limited, MetLife Investments Asia Limited, MetLife Latin America Asesorias e Inversiones Limitada, MetLife Asset Management Corp. (Japan), MIM I LLC, MetLife Investment Management Europe Limited, Affirmative Investment Management Partners Limited and Raven Capital Management LLC.


