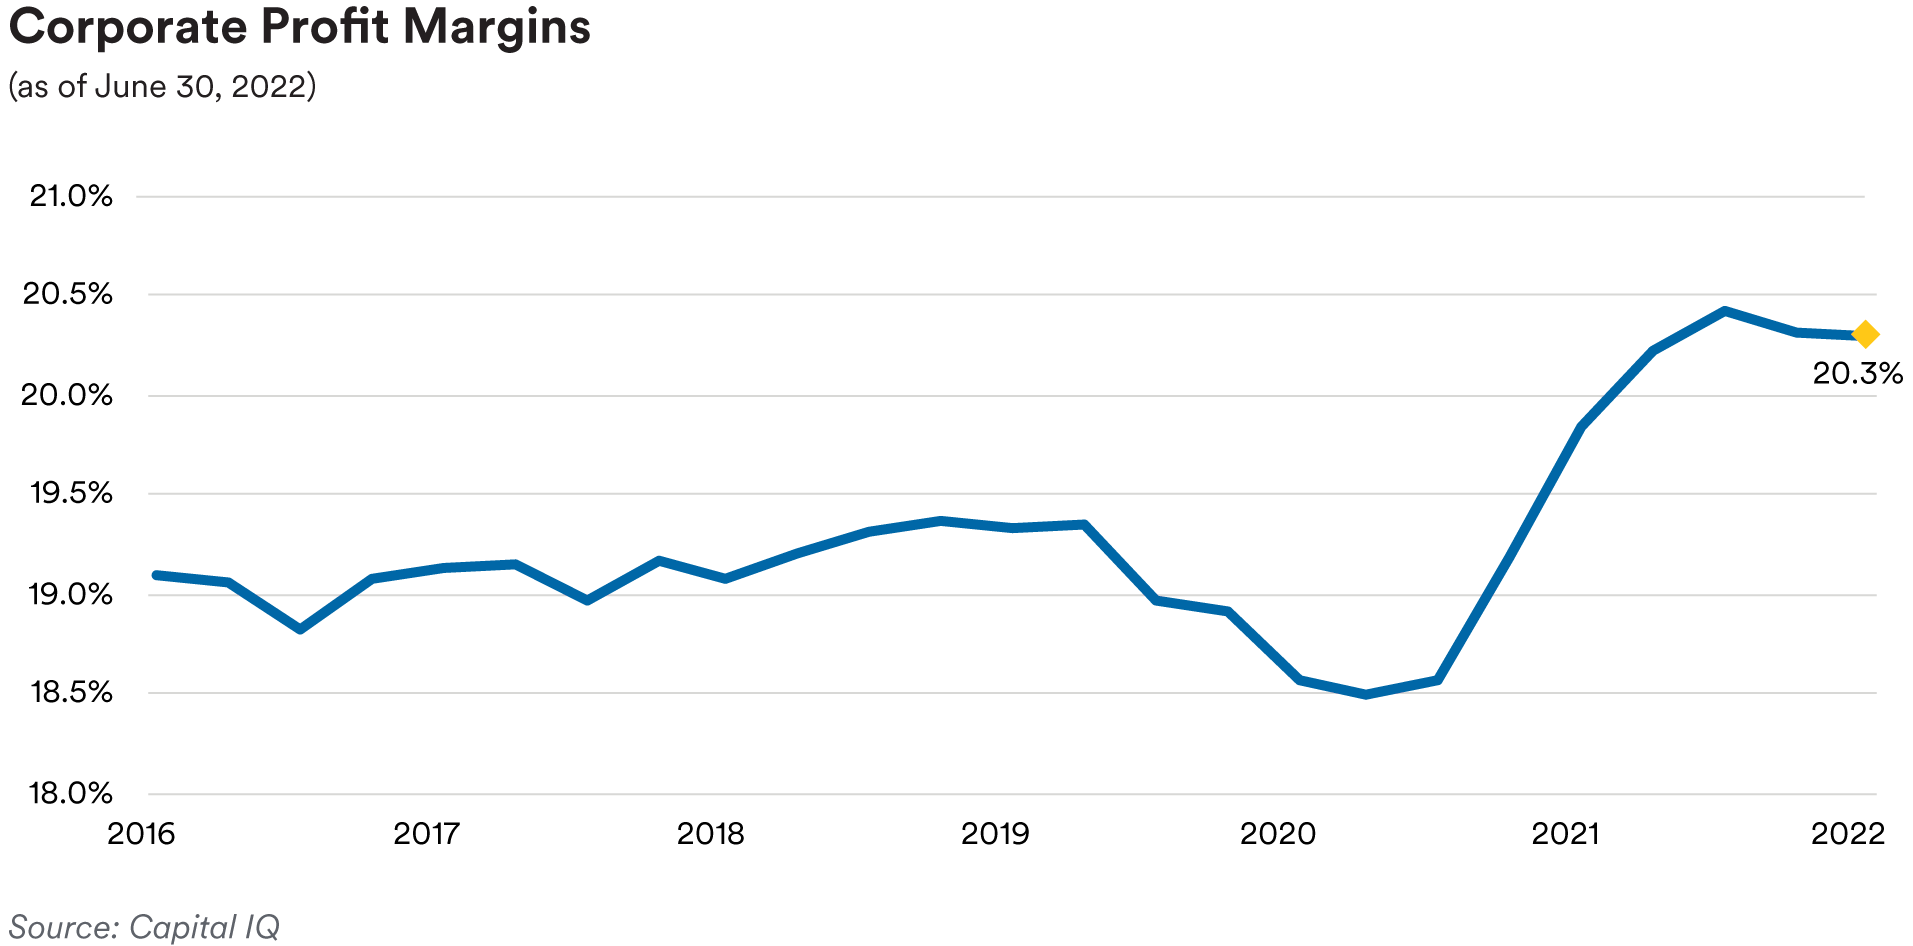
Turning to corporate credit fundamentals, we saw more evidence of stress on corporate profit margins and earnings throughout the third quarter as issuers reported second-quarter earnings growth at the slowest pace since fourth-quarter 2020 with many lowering guidance prior to printing results (72 companies in the S&P 500 Index).1 Although many issuers successfully passed along higher costs by raising prices, a large number continued to experience supply chain-driven cost pressures and increased labor expense while being unable to fully protect their operating margins. FactSet’s consensus expectation for upcoming third-quarter bottom-up earnings for the S&P 500 index’s constituents has been reduced at the fastest pace since second-quarter 2020, when the pandemic took hold, and is currently 2.9%. With earnings growth rapidly decelerating, on the positive side aggregate debt leverage has continued to creep lower with no signs that the consumer-driven U.S. economy is falling out of bed. Additionally, retail sales indicators have not been strong but consumer confidence measures have been trending higher off the summer’s lows, undoubtedly helped by the easing of gas prices and weaker month-over-month headline inflation readings for July and August. We remain on the lookout for signs of softening in the labor market or the potential for consumer spending to turn lower as the Federal Reserve sticks to its hawkish monetary policy tightening script.
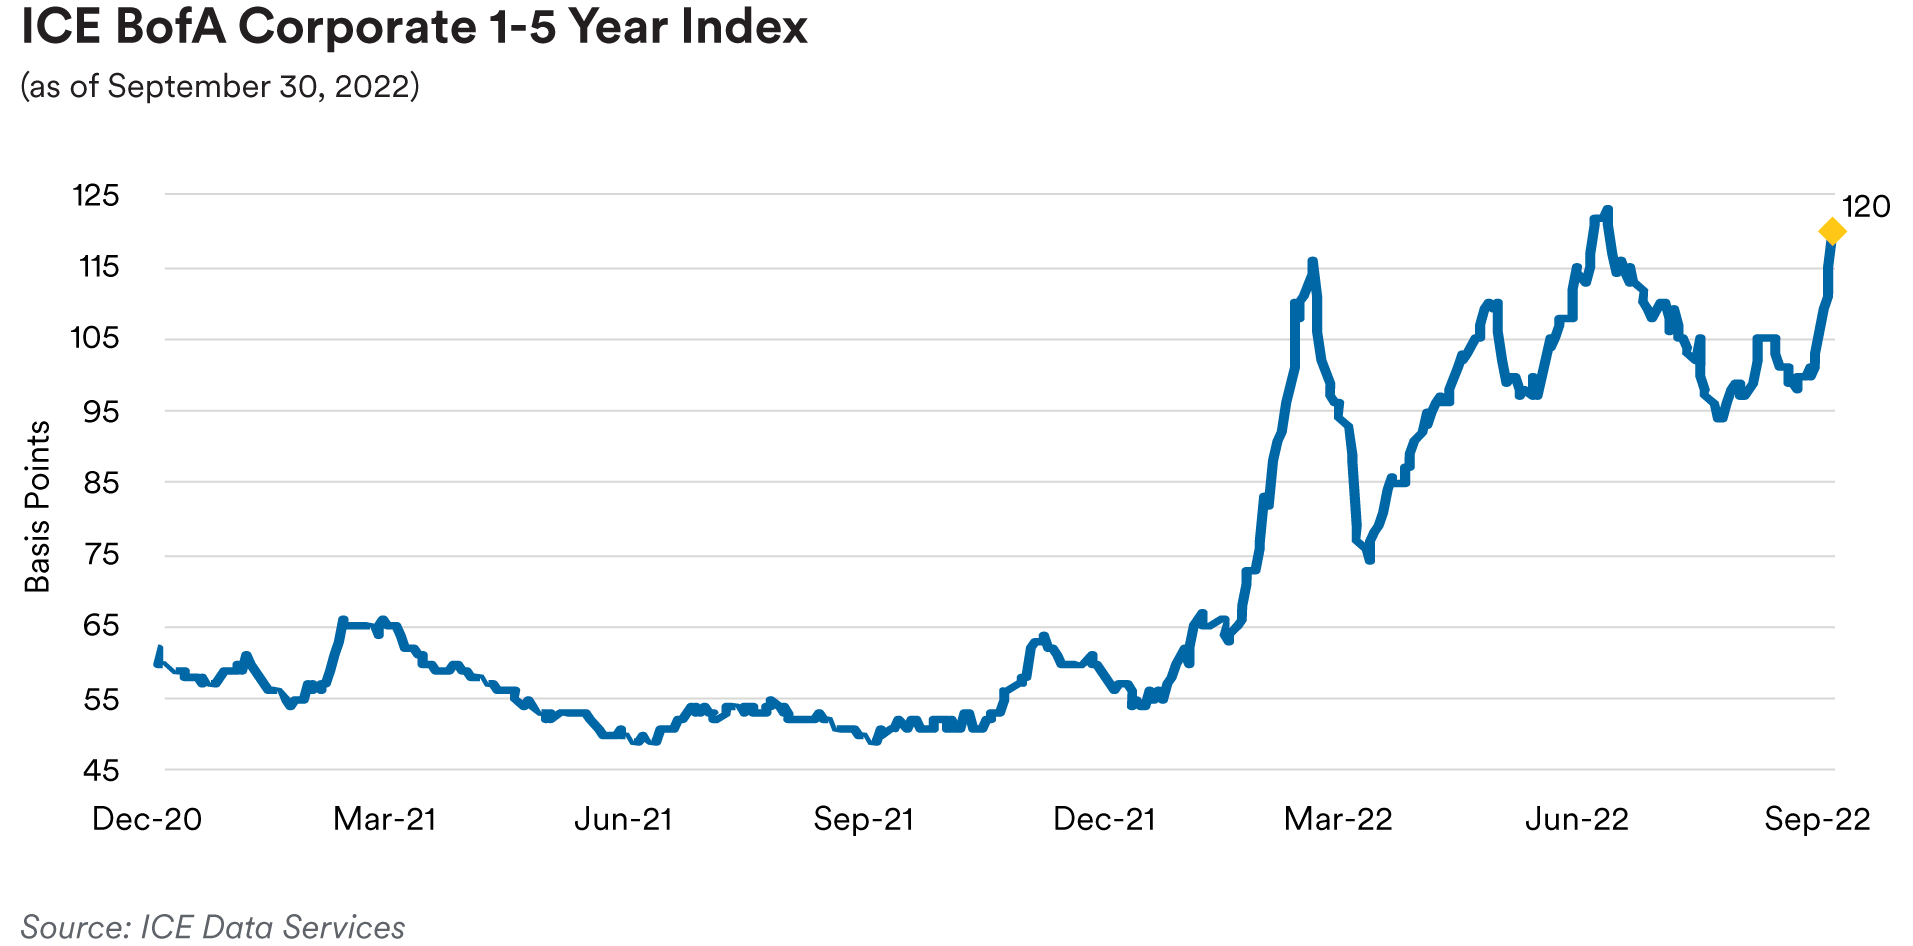
Portfolio Actions & Outlook: The ICE BofA 1-5 Year U.S. Corporate Index, our bellwether front-end investment grade corporate index, closed out the third quarter at an option-adjusted spread (OAS) of 120 basis points, 1 basis point tighter than where the index began the quarter. That small change masked some of the extreme market moves and episodes of volatility that shook investors as it relates to tighter monetary policy confidence over the quarter. Although corporate credit fundamentals across most corporate subsectors remain on a decent footing, based on our belief that risks are tilted in favor of the global economy slowing more decidedly in the quarters ahead, coupled with central banks unwilling to collectively take their foot off the gas to avert a hard landing, we reduced our risk positioning in investment grade credit across strategies in the third quarter as we believe credit spreads are poised to move wider. This was accomplished most decidedly in our longer 1-3 year and 1-5 year strategy portfolios, where the negative impact of spread widening is higher. Even in our shortest dated strategy portfolios, consistent with our selling in the longer strategies, we trimmed investment grade credit sector weightings and spread durations. This was effected by reducing exposure to some of our less favored, more cyclically-exposed subsectors and more non-U.S.-exposed holdings, including Yankees.
In our shorter strategies across portfolios, our purchases were confined to a few relatively short dated, one-year secondary bonds at attractive all-in yields as interest rates crept higher while we sold some of the aforementioned more cyclical and Yankee positions, utilizing the proceeds to increase our Treasury sector weightings. In our 1-3 year portfolios in the third quarter, we were very selective in adding some three-year Aaa-rated Canadian bank covered bonds, two-year U.S. utility bonds and a Swiss bank’s three-year / non-call two-year new issue, which was subsequently sold before quarter end. Most of the trading activity in our 1-3 year strategy portfolios represented selling mainly relatively short-dated positions in less favored, more cyclically-exposed subsectors in addition to more non-U.S.-exposed issuers, including Yankees. It was much the same story in our 1-5 year portfolios. We purchased a five-year Aaa-rated Canadian bank’s new issue covered bonds as well as a five-year A-rated new issue from a U.S. utility. We reduced overall exposure and sector spread duration in the 1-5 year strategy portfolios meaningfully heading into quarter end by selling five-year corporates as well as some of our shorter dated cyclically-sensitive and Yankee positions. Not unlike the previous two quarters, we continued to be opportunistic in executing our sales given that secondary market trading liquidity continues to ebb and flow with the macro backdrop of elevated volatility on a daily basis.
We continue to maintain a somewhat cautious outlook on the investment grade credit sector in favoring more defensive subsectors like banking, insurance, communications, consumer non-cyclicals, technology, and electric utilities. We believe most of the companies in these subsectors should prove more resilient in the event economic growth headwinds increase in the quarters ahead as we anticipate. Expectations of further tightening in financial conditions and greater pressure on issuers’ operating fundamentals and profit margins with the economy facing the prospect of a sharper slowdown in growth or a recession will likely translate into wider credit spreads eventually. While we saw spreads end the quarter roughly flat with where they ended the second quarter as interest rates again rose, pushing all-in yields higher, we were content to effectively sell into strength on days when market liquidity was sufficiently ample as we sit positioned with a reduced sector weighting compared to our historical norms across strategies.
We anticipate preserving a generally reduced weighting and spread duration exposure to investment grade corporates until the macro landscape brightens or credit spreads widen materially to better reflect the underlying credit fundamental conditions as we see them. Supply chain disruptions and elevated pressures on costs and operating margins for many companies will be with us into 2023, weighing on fundamentals and potentially increasing risks of rating downgrades, especially if a hard landing develops. Thus, for the time being we remain a bit captive to the determination and success of the Fed and other hawkish central bankers in their efforts to hike policy rates to lower inflation back toward their targets, which could eventually cause something unforeseen to break in markets, like we recently saw in the UK. Against such a backdrop, we prefer to hold more up-in-quality securities in select subsectors as noted above that are better poised to weather a more challenging economy as well as investing in front-end corporates at attractive all-in yields less vulnerable to the impact of any potential spread widening.
Performance: In the third quarter the investment grade credit sector was a positive contributor to relative performance across strategies. As mentioned, credit spreads completed a bit of a round trip in tightening in July, August and through mid-September before gapping out to end essentially where they began. Nonetheless, for the quarter excess return for our front-end benchmark 1-5 year U.S. corporate index was positive for the first time since third-quarter 2021. September’s move wider in spreads was part of a risk-off shift that included renewed interest rate volatility, continued hawkish central bank policy, lowered economic growth expectations, and growing signs of select market dislocations. Within investment grade credit strongly performing subsectors included Banking, Insurance, Diversified Manufacturing, Retailers, and Electric Utilities partly offset by weakness in the Health Care subsector, where negative excess returns in our 1-3 year and 1-5 year strategy portfolios stemmed from spread widening in selected hospital issuer bonds.
Treasuries / Agencies
The third quarter of the year was defined by continued inflation concerns in the Treasury market as rates across the curve moved through the prior cycle’s highs with front-end yields peaking north of 4.40%. Chair Powell once again raised his hawkishness with a dot plot showing a terminal rate at 4.6% and laid the groundwork for another 75 basis point hike in November. The continued repricing of Fed expectations in the front end of the rates market also resulted in continued elevated volatility, which hit its highest levels since the Global Financial Crisis (GFC). Daily basis point moves being priced into the front end of the Treasury market moved to over 11 basis points a day near the end of the quarter, more than twice what we saw at the start of the year. The Merrill Lynch Option Volatility Estimate (MOVE) Index, which is a yield curve-weighted index of the normalized implied volatility on Treasury options across the maturity spectrum, continued to spike higher in the third quarter to levels last seen in the summer of 2009.
-Index-3Q-2022.png)
Regarding domestic monetary policy, the Fed hiked by 75 basis points in July and September with the latter accompanied by upward revisions to the dot plot showing the potential for another 75 basis point hike November, 50 basis points in December and another 25 basis points in February of next year. The market continued to reprice Fed hiking expectations dramatically higher with the year-end 2022 projected Fed Funds rate moving from 338 basis points at the start of the quarter up to 424 basis points by the end of the quarter. The peak Fed Funds rate was also repriced with expectations for a 4.50% funds rate by the end of Q1 2023. In addition, quantitative tightening reached its terminal high in September with the maximum rundown pace of $60 billion per month in Treasuries and $35 billion per month in MBS.1 This along with increased volatility in the Treasury market led to a significant deterioration in market liquidity in the sector. Various measures of liquidity showed the Treasury market, especially the front end, to be functioning as poorly as it did at times in March 2020. Unlike March 2020, however, the deterioration in liquidity has been more sustained and bears watching.
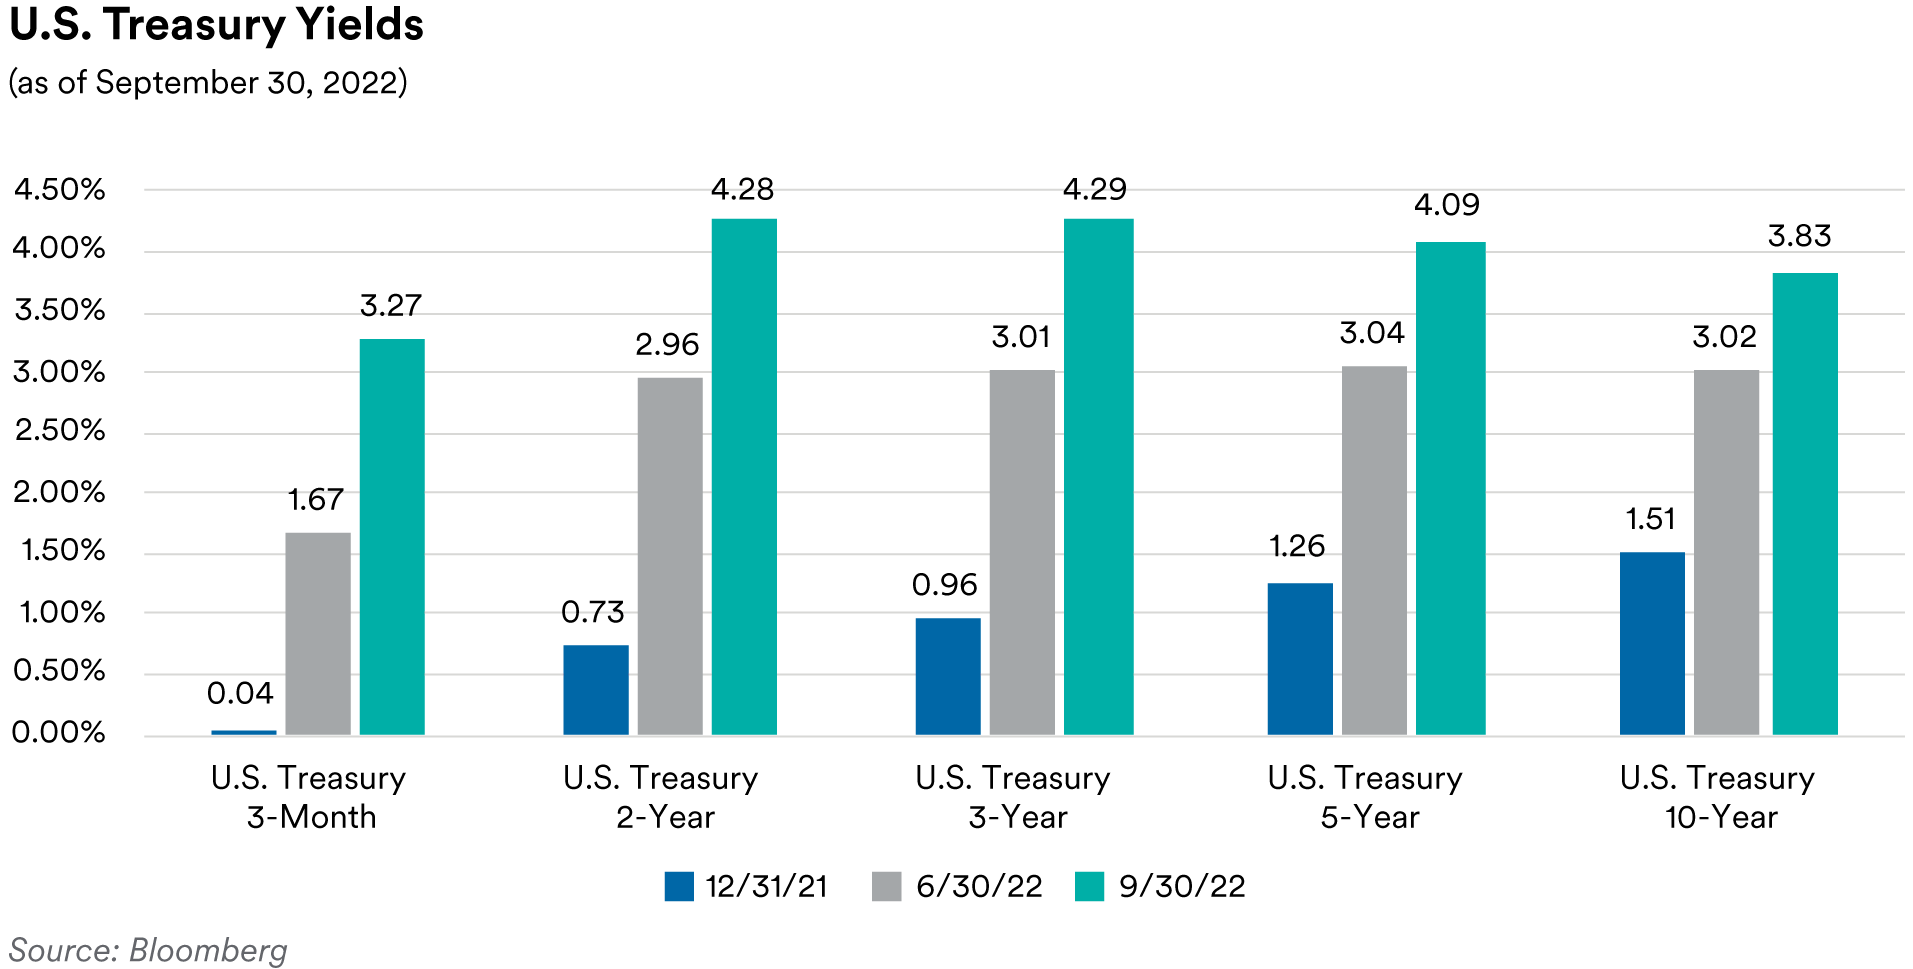
The very front end of the market led the sell-off in the third quarter as short rates responded to the promise of more rate hikes to come. Three-month, six-month and one-year Treasury bill yields were 162 basis points, 145 basis points and 119 basis points higher during the quarter, respectively.
Two-year Treasuries moved 133 basis points higher during the quarter, ending at 4.28%. Five-year Treasuries sold off slightly less but still moved 105 basis points higher during the quarter. Ten-year Treasuries were 82 basis points higher during the quarter as yields across the curve peaked towards the end of the quarter before rallying slightly into quarter end. After moving in a parallel manner in the second quarter, the yield curve resumed its dramatic flattening in the third quarter. The spread between the ten-year Treasury and the two-year Treasury moved from 6 basis points at the start of the quarter to -45 basis points at the end of the quarter. The spread between the five-year Treasury and two-year Treasury moved from 9 basis points at the start of the quarter to -19 basis points at the end of the quarter.1
TIPS breakeven inflation rates started the quarter moving higher as nominal Treasury yields fell. However, after peaking in mid-August, a continued hawkish Fed led to a sharp decline in inflation breakeven rates in the latter half of the quarter, providing a vote of confidence to the Fed’s inflation fighting credibility. Looking at the two-year TIPS breakeven inflation rate, it moved from 329 basis points at the start of the quarter to 198 basis points at the end of the quarter. Further out the curve, TIPS breakeven inflation rates also moved lower but not as much as the very front end which tends to be driven more by commodity prices. Five-year TIPS breakeven rates were 45 basis points lower during the quarter, and ten-year TIPS breakeven rates were 19 basis points lower. With TIPS breakeven rates moving lower, real yields (yield adjusted for inflation expectations) moved significantly higher during the quarter. The five-year real yield rose, from 44 basis points to start the quarter to 199 basis points to end the quarter (highest real yield since 2008). The ten-year real yield went from 67 basis points to 167 basis points during the same period (highest level since 2010).
Front-end Government-Sponsored Enterprise (GSE) agency spreads moved slightly wider over the third quarter as the option-adjusted spread (OAS) of the ICE BofA 1-5 Year U.S. Bullet (fixed maturity) Agency Index ended the quarter at 4 basis points, a basis point wider from the start of the quarter. In the SSA subsector, U.S. dollar-denominated fixed-maturity securities saw spreads marginally tighten by 2 basis points and finish the third quarter, on average, at 30 basis points over comparable-maturity Treasuries. Agency callable spreads continued widened to Treasuries as short-dated and short-expiry volatilities in the upper left portion of the volatility surface took another leg up in September. We saw net supply from the Federal Home Loan Bank (FHLB) reach $88 billion in September and as a result FHLB’s total debt outstanding exceeded $1 trillion, close to the highest levels since 2007. This suggests FHLB’s advances (loans to their members) also had significant increases over the third quarter, due to increasing demand for liquidity from depository institutions which include commercial banks, savings institutions, and credit unions. Amid elevated economic uncertainty we believe it is prudent for members to have taken out advances and saw the increase of FHLB’s debt firsthand, led by issuance in discount notes and front-end bullets.
Portfolio Actions & Outlook: In the third quarter, we continued to increase our allocations to Treasuries as we sold down spread product across our portfolios. We opportunistically bought nominal Treasuries to add duration at specific points on the curve across our portfolios. Given the moves in rates, implied volatilities and spreads year-to-date, Agency callable coupons are at the highest levels since 2009. Two to three-year callables with mostly three-month lockout structures look particularly attractive as the upper left part of the implied volatility surface remains extremely elevated. We were able to add quite a bit of yield by selling upper left volatilities in adding to these types of callable structures across most strategies during the quarter.
As we enter the fourth quarter, market expectations are for the Fed to tighten monetary policy aggressively with another 125 basis points of hikes priced in by year-end 2022 and 150 basis points of hikes in total priced in by end of Q1 2023 (in line with Fed terminal rate projections). We may be within six months of the last rate hike of the cycle but much of that depends on inflation starting to move lower in the near term. After the hiking cycle is completed, the FOMC has tried to guide the market towards a scenario in which the Fed Funds rate will be held steady through much, if not all of 2023. With so much uncertainty in the market, volatility should continue to remain elevated and callable Agencies should continue to look attractive. From a duration standpoint, the market seems fairly priced now with a slight bias towards lower yields. In an environment of challenged liquidity and high risk aversion, we continue to think SSAs remain unattractive. Looking ahead, as the majority of major European SSAs have completed over 90% of their annual funding, we expect any additional supply to come mainly from supernational issuers. We expect FHLB’s advances and debt outstanding to continue to rise in the near future. Anticipating higher rates, banks are preparing themselves for slower growth, or even a decline in deposits and tighter liquidity conditions during this hiking cycle.
Performance: Our slightly short to neutral duration posture and barbell-biased yield curve positioning relative to benchmark indices were additive to excess returns while the Agency sector saw modestly negative excess returns as rates rose and extended the duration of our callable positions.
ABS
Recap: Spreads on short-tenor ABS tranches moved tighter over the course of the third quarter with the exception of credit card tranches which widened on heavy new issue supply. Spreads on benchmark three-year, AAA-rated credit card, prime auto and subprime auto tranches moved 7 basis points wider and 4 and 25 basis points tighter, respectively. Three-year floating-rate FFELP student loan tranches were also 18 basis points tighter on the quarter, finishing at a spread of 102 basis points over the SOFR index. Student loan tranches found support following the administration’s announcement of a loan forgiveness program for student loan borrowers. Away from the credit card subsector, overall ABS new issuance was modest with over $55 billion of new deals pricing, well below the $73 billion that priced in the second quarter. As usual, the auto sector was the leading contributor with over $24 billion of new deals coming to the market. This was followed by $12 billion of issuance in the “other ABS” subsector (which includes collateral like cell phone payment plans, timeshares, mortgage servicer advances, insurance premiums, aircraft leases, etc.) and $9 billion of credit card issuance. As noted above, credit card issuance has been heavy this year with over $25 billion of deals pricing so far. In comparison, only $17 billion of credit cards priced during all of 2021.1
Supported by a healthy jobs market, credit card trust performance remains firm despite the challenges of higher interest rates and inflation for the consumer. Data from the September remittance reporting period and aggregated in the JP Morgan credit card performance indices showed charge-offs and 60+-day delinquencies on bank credit card master trusts falling over the quarter by 17 basis points and 1 basis point respectively, to 1.01% and 0.56%, still below pre-pandemic levels. However, we still anticipate deterioration in trust performance going forward given the headwinds facing consumers. Also, we are mindful of the fact that ABS bank credit card trust collateral contains an extremely narrow subset of consumers (generally very seasoned, prime quality borrowers) who may not be fully representative of the broader marketplace.
New vehicle sales rebounded in September to a 13.5 million SAAR (seasonally-adjusted annualized rate) pace after disappointing in August at 13.2 million SAAR. Auto analysts attributed the rebound in sales to greater availability of new inventory which rose to a 14-month high of 1.3 million units. Sales have generally moved higher from the year’s low of 12.7 million SAAR seen in May but are still far below the post-financial crisis high of 18.5 million seen in April last year and the 16 million average seen over the last decade.1 In our view, while supply chain issues appear to be improving, rising interest rates and prices are likely to constrain demand going forward. Cox automotive noted that subprime buyers accounted for about 14% of new-vehicle market transactions in 2019 but only 5% of the current market with deep-subprime buyers almost completely absent. Going forward, it seems likely to us that higher-priced luxury vehicles will increasingly dominate the new-vehicle sales as higher prices force subprime and lower income borrowers into the used car market. With new vehicle inventories expanding, used car prices, as measured by Manheim Used Vehicle Index, declined over the course of the quarter. The index closed the quarter at 205.9, a 12.8% decline from the 236.2 level seen at the start of the year. On an annualized basis, used car prices are up only 0.6% compared to last September.
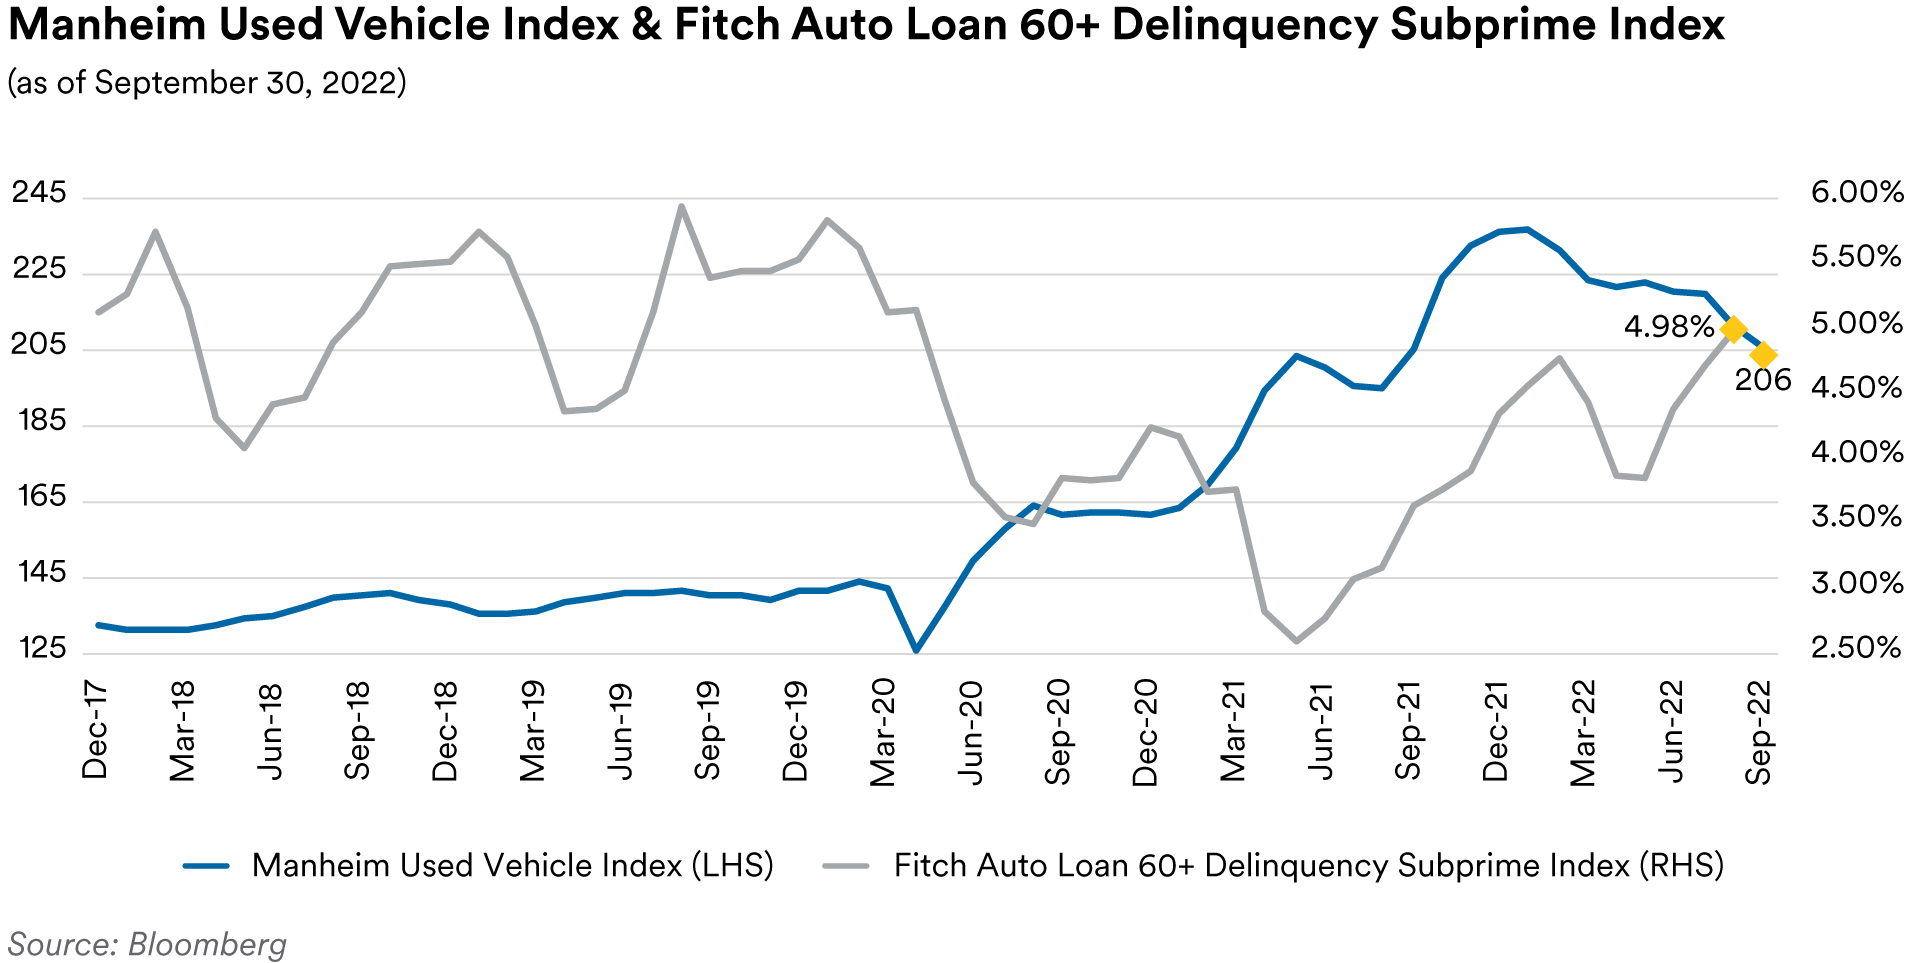
Declining used car prices, together with the headwinds from rising inflation and higher interest rates have begun to pressure auto ABS performance. As of August’s, data, the 60+-day delinquency rates on the Fitch Auto ABS indices were 0.22% for the prime index and 4.98% for the subprime index, numbers which reflect increases of 7 basis points and 182 basis points, respectively, from last year’s levels. Similarly, annualized net loss rates for the indices stand at 0.18% for the prime index and 6.35% for the subprime index, 5 basis points, and 330 basis points higher, year-over-year, respectively. In our view, the marked divergence between the prime and subprime metrics illustrates the fact that prime borrowers are much better positioned to whether deteriorating economic conditions than subprime borrowers. As we have noted in prior commentaries, despite this expected downturn in performance, we are comfortable with our holdings in AAA and AA-rated auto tranches as we believe these deals have ample credit enhancement to protect bondholders.
Portfolio Actions and Outlook: Over the course of the third quarter, we modestly reduced our ABS exposure across most of our strategies. The exception was in our longest 1-10 Year strategy where we modestly increased our exposure by adding credit card positions. Notably, credit cards have been absent from our longer strategy since the second quarter of 2021 due to their relatively tight spreads. We used the recent weakness in credit card spreads noted above to add some exposure early in the quarter. Generally, we sought to remain defensive and limit portfolio spread duration. We reduced our subprime auto exposure in our shorter strategies by abstaining from participation in new issue deals and allowed prepayments to reduce the outstanding balances of our portfolio holdings. Highlighting some examples of new issue activity, early in the quarter we purchased the AAA-rated, 1.4-year average life tranche of a new issue cell-phone device payment deal at a spread of 67 basis points over Treasuries and later in the quarter we purchased the AA-rated, 0.9-year average life tranche of a prime auto credit risk transfer deal at a spread of 170 basis points over Treasuries.
In our view, as in the second quarter, current spreads on most benchmark short-tenor ABS tranches are fair given the environment. However, we are mindful of the deteriorating consumer fundamentals so anticipate remaining very defensive and limiting adds to our current spread duration. Accordingly, while we expect to generally maintain current levels of ABS exposure by reinvesting the proceeds of paydowns on our holdings we are unlikely to materially increase exposure to more spread duration-sensitive sectors like private student loans, CLOs, and time-share receivables. Overall, we are content to wait for greater certainty around the future path of the economy, interest rates and the outlook for consumers before seeking to increase ABS exposure significantly.
Performance: Our ABS holdings produced mixed results across our strategies in the third quarter. In our shorter strategies, ABS positively contributed to excess performance while in our longer portfolios excess returns from the sector were negative. This divergence was the result of our holdings in private student loans which are more concentrated in our longer strategies and for the second quarter in a row, saw significant spread widening. Our auto holdings were generally the best performers and their higher weighting in our shorter strategies drove the overall positive ABS attribution. Our CLO holdings were marginally positive contributors for the quarter.
CMBS
Recap: In comparison with like-duration Treasuries, the third-quarter performance of short-tenor CMBS securities was mixed. At the end of the quarter, spreads on three-year AAA-rated conduit tranches stood at 111 basis points over Treasuries (1 basis point wider) and spreads on five-year AAA-rated conduit tranches stood at 122 basis points over Treasuries (10 basis points wider). However, three-year Freddie Mac “K-bond” agency CMBS tranches moved 2 basis points tighter to end the quarter at a spread of 34 basis points over comparable Treasuries. We attribute the relative outperformance of three-year agency tranches to investor preferences for short-tenor, highly liquid government-backed securities in an environment of rising interest rates and increasing macro volatility. Over the course of the quarter over $52 billion of new issue CMBS came to market, well behind the $78 billion seen in the third quarter of 2021. The largest portion of the decline was in the non-agency sector which saw $16 billion of new issuance this quarter, compared to $37 billion in the third quarter last year, a decline of over 56%. In contrast, agency CMBS issuance declined only 13% compared to last year with over $36 billion of new agency deals pricing in this year’s third quarter compared to almost $42 billion last year.1
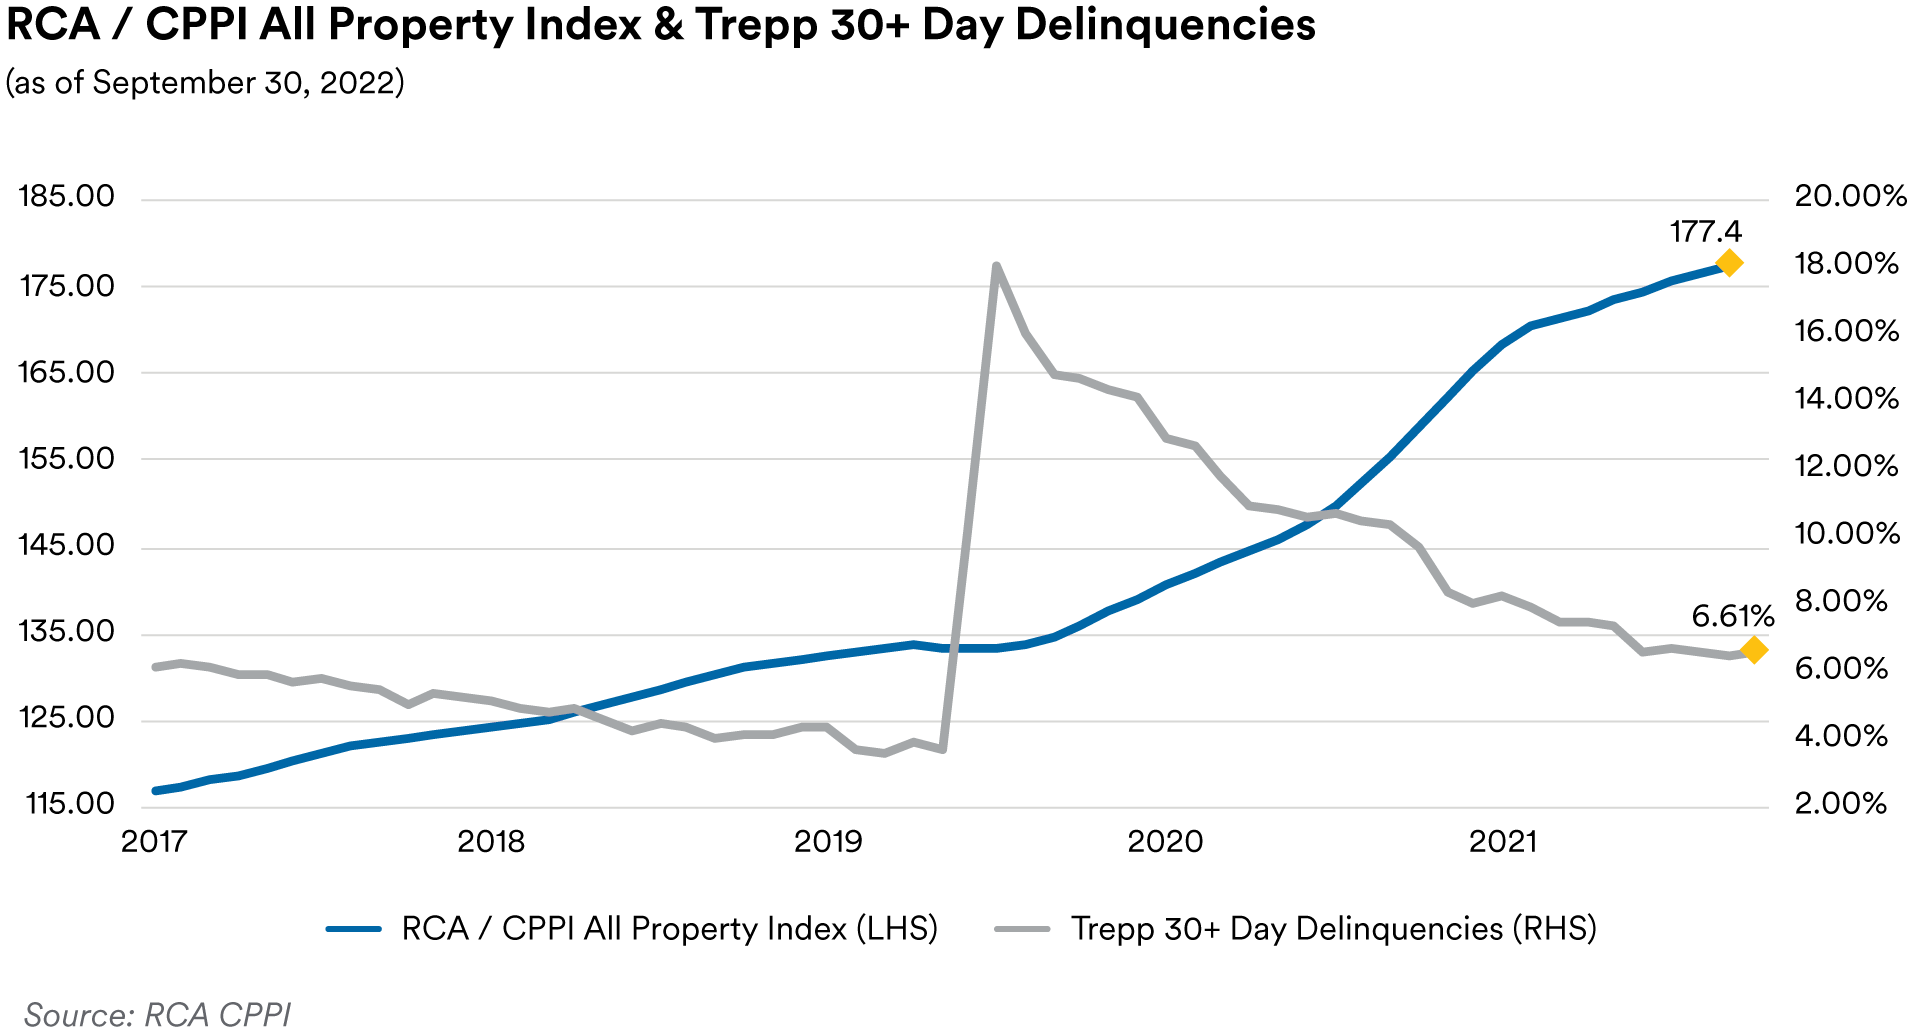
Despite rising interest rates, inflation and macro volatility, CMBS delinquencies fell over the course of the quarter. As measured by the Trepp 30+-day delinquency rate, CMBS delinquencies ended September at 2.92%, a decline of 28 basis points for the quarter and 165 basis points for the year. The delinquency rate has now fallen for 25 of the last 27 months since reaching the Covid-19 high of 10.32% in June 2020 (the all-time high on the rate was 10.34% seen in July 2012). Lodging properties saw the largest improvement in delinquencies, falling 92 basis points to 5.02% as business and vacation travel continued to rebound from pandemic lows. On a year-over-year basis, lodging delinquencies have now fallen 643 basis points and have passed the dubious crown of worst-performing subsector to retail properties. Retail delinquencies ended the quarter at 6.61%, down 8 basis points for the quarter and 314 basis points year-over-year. Industrial properties remain the top performer with delinquencies in that subsector dropping 6 basis points over the quarter to 0.43%. On a year-over-year basis, industrial property delinquencies have declined 16 basis points.1
Commercial property prices continued to rise over the quarter with the September release of the RCA CPPI National All-Property Composite Index showing prices rose 14.0% year-over-year through August to 177.4, another record high. However, RCA noted that August’s rise was the slowest pace seen this year and well below the record 20.0% growth rate at the start of 2022. RCA noted that all property types saw slower growth rates in August, with industrial properties showing the largest year-over-year increase at 24.7%. Both apartment and retail properties have now shown decelerating growth for sixth months in a row, with August slowing to 17.1% and 16.0% year-over-year growth rates, respectively. Office properties continue to show the slowest growth, with prices rising 7.3% year-over-year.1
The current release of the Fed Senior Loan Officer Survey, reflecting sentiment as of July, showed banks having tightened standards on commercial real estate loans of all categories. Banks also reported expecting to continue to tighten lending standards across all loan categories over the second half of 2022. The most cited reasons for tighter lending standards were an expected deterioration in borrowers’ debt-servicing ability due to higher inflation, expected deterioration in collateral values, an expected deterioration in the credit quality of loan portfolios and reduced risk tolerance. In our view, the survey results are another indication of the challenges facing the economy and are likely to worsen CMBS collateral performance over the next several quarters.
Portfolio Actions and Outlook: During the quarter, we increased our exposure to CMBS in our 1-3 Year strategy portfolios and generally maintained our exposure in our longer strategies. The increase was in the fixed-rate agency and conduit subsectors as we did not add to our floating-rate non-agency holdings. We continue to favor agency tranches for their superior liquidity profile. Within conduits, our focus was on adding AAA-rated schedule balance “ASB” tranches. In our view, ASB tranches are defensive and offer generally stable average life profiles across a broad range of collateral prepayment and default scenarios. We participated in one new issue deal, purchasing the AAA-rated, 2.3-year average life, front-pay tranche conduit securitization at a spread of 135 basis points over Treasuries for our 1-3 Year strategy. Going forward, we expect to generally maintain our CMBS allocations across portfolios. With spreads at their current levels, we will continue our current strategy and reinvest the proceeds of paydowns and maturities of existing holdings with purchases of short-tenor agency CMBS bonds and conduit ASB tranches. We continue to avoid most deals with pronounced exposures to retail, office and lodging properties.
Performance: After adjusting for duration and yield curve exposure, we saw mixed performance from our CMBS holdings in the third quarter. Our CMBS holdings generated positive excess returns in our shorter strategies and negative excess performance in our longer strategies. The divergence stemmed from our holdings of longer duration conduit tranches in the longer strategies which, as noted above, suffered from a greater degree of spread widening than shorter tranches. Our agency holdings were generally flat as were our floating-rate single-asset, single-borrower (“SASB”) positions.
MBS
Recap: Residential mortgage-backed securities widened on spread over the third quarter as rising interest rates, concerns about inflation, increased macro volatility and ongoing worries about the possible sale of mortgages from the Fed’s balance sheet all weighed on the sector. September was particularly painful as a large move in rates and jump in volatility caused significant underperformance with the Bloomberg mortgage index posting its worst monthly excess return on record (-1.91%). Overall, generic 30-year collateral ended the quarter at a spread of 184 basis points over ten-year Treasuries (47 basis points wider) while 15-year collateral ended the quarter at a spread of 88 basis points over five-year Treasuries (23 basis points wider). We attribute the relatively better performance of 15-year collateral to investor preference for shorter duration securities in a rising rate environment and the fact that the Fed Reserve’s portfolio is overwhelmingly (~88%) composed of 30-year collateral, which would bear the brunt of any future Fed selling. Non-agency spreads were optically tighter over the quarter with prime jumbo front cashflow tranches ending the quarter at a spread of 140 basis points over Treasuries (44 basis points tighter) but that reflects a significant step-up in benchmark new issue pricing coupons with new issue deals now coming to market as 5.0% coupons in comparison to the 2.5% coupons seen in the second quarter. Ignoring new issues and looking at prior 2.5% deals trading in the secondary markets, non-agency spreads actually moved 15 basis points wider.
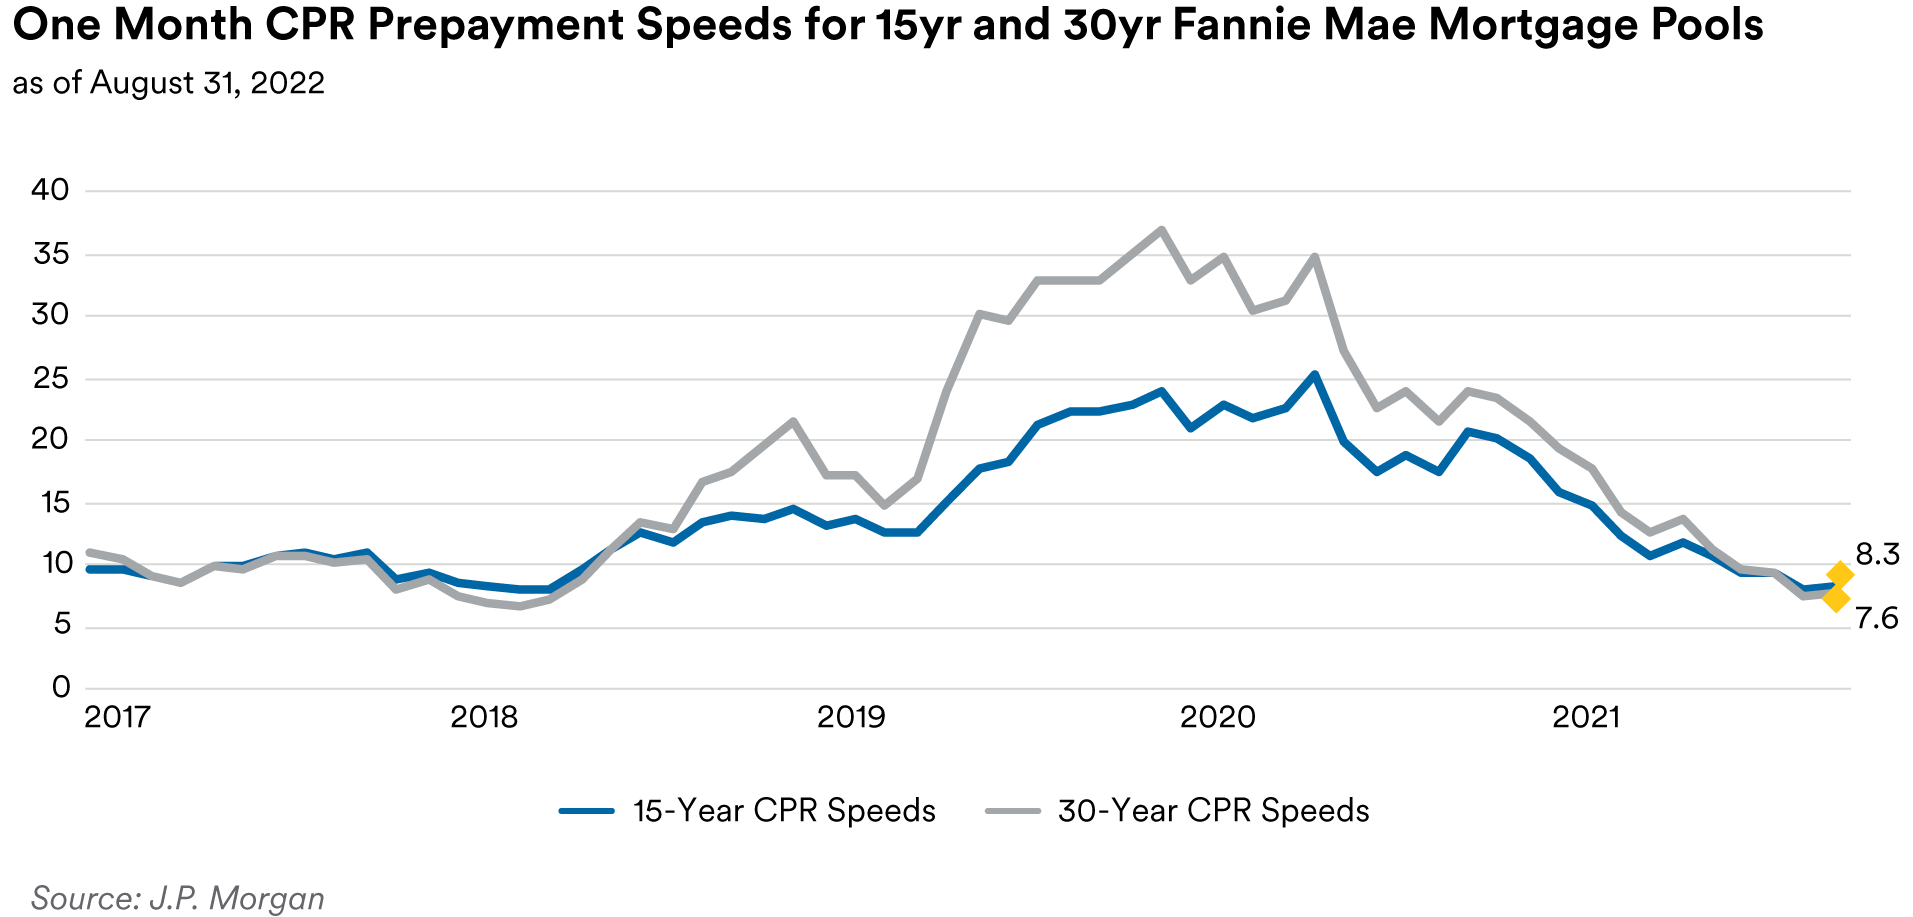
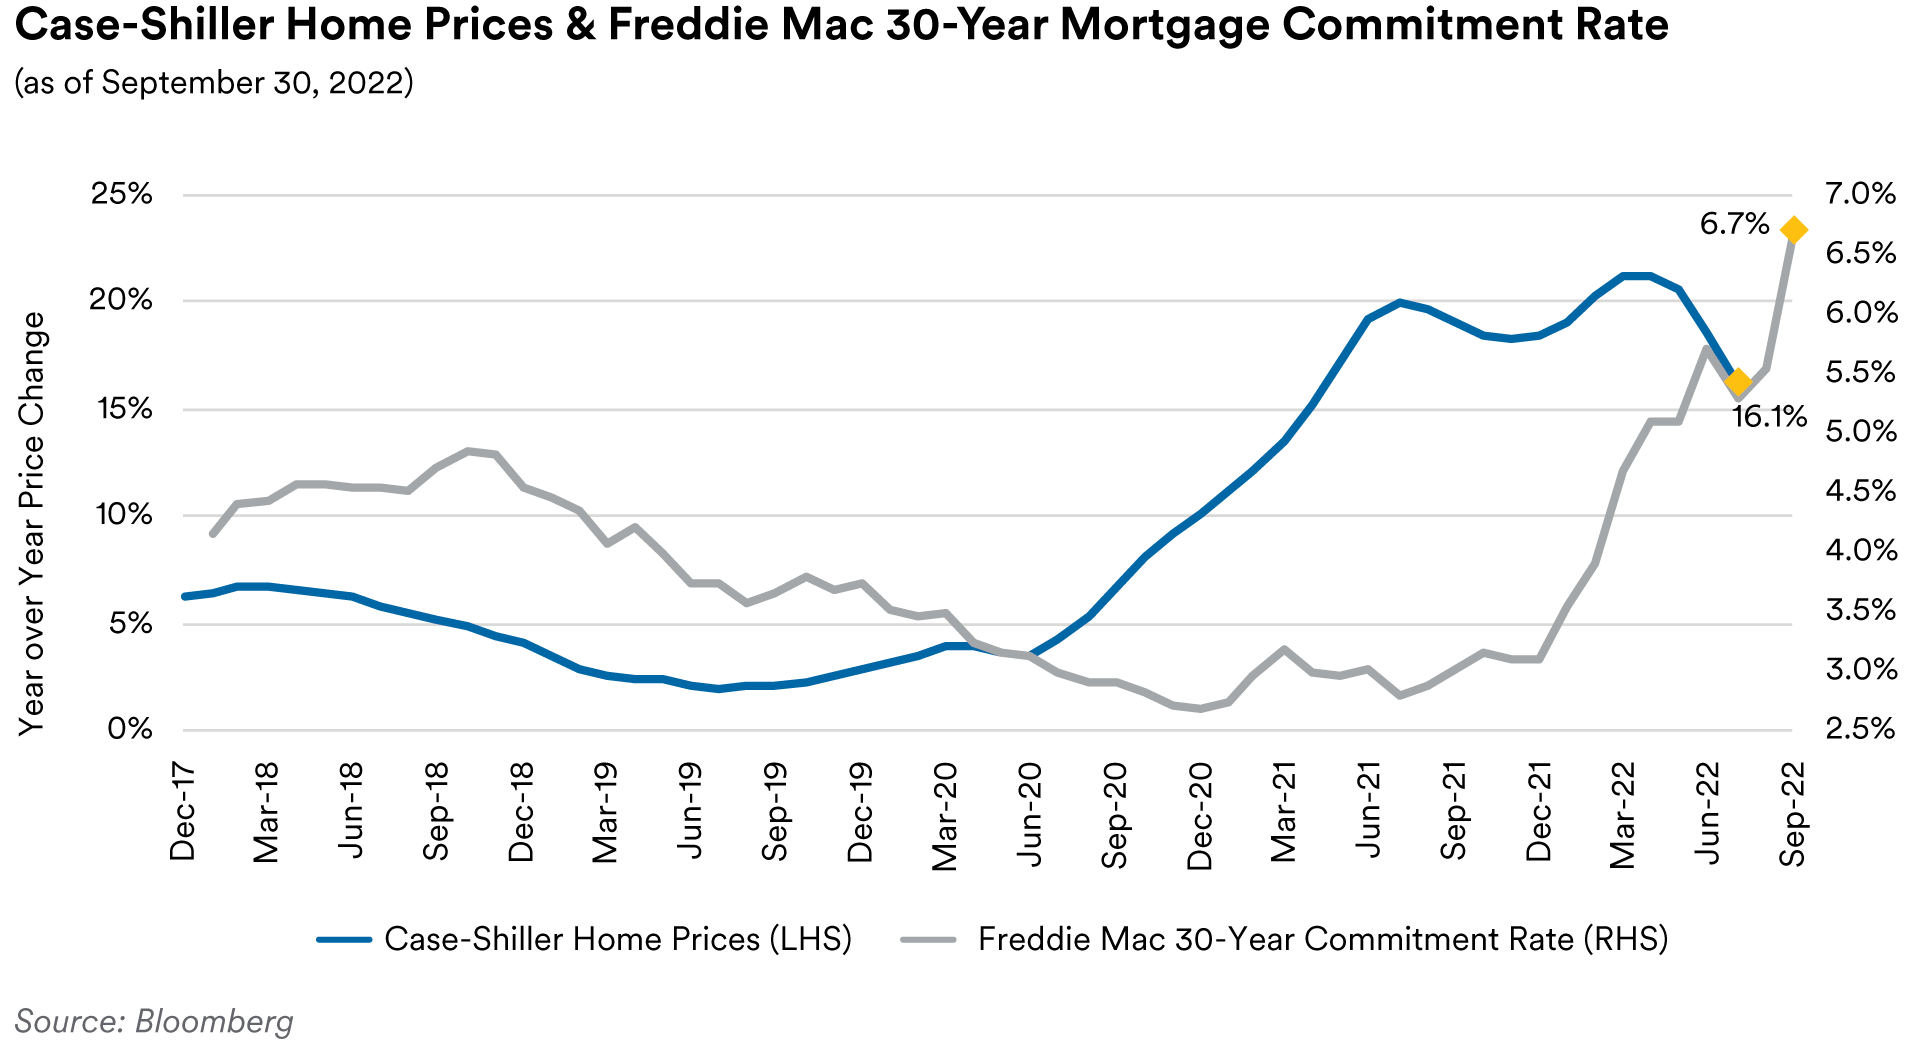
Mortgage rates continued to move higher over the third quarter as the Fed raised rates. The Freddie Mac 30-year mortgage commitment rate rose 100 basis points over the quarter to 6.70%, the highest level seen since July 2007. With current rates driving most mortgages out of the refinancing window, prepayments have dropped close to base “turnover” levels.1 October’s prepayment report showed speeds on Fannie Mae 30-year mortgages paying 6.8 CPR in September, a decline of 13% compared to August’s 7.8 CPR print, which was flat to July’s level, following a drop from 9.3 CPR in June. Fannie 15-year speeds came in at 7.4 CPR, down 12% compared to 8.4 CPR in August, a 2% uptick relative to the 8.2 CPR seen in July but still lower than June’s 9.4 CPR print.1 With interest rates now at levels not seen since 2007 and winter seasonal factors coming into play, we expect prepayment levels to drift even lower over the next several months. As rising mortgage rates created challenges for buyers, home price growth decelerated over the quarter. The September release of the S&P CoreLogic Case-Shiller 20-City Home Price Index showed home prices fell month-over-month in July, the first monthly decline in prices in a decade. On an annualized basis, the report showed home prices rose at a 16.1% pace through July, behind economists’ projections and the third consecutive month of lower annualized gains. The Sunbelt metros continued to show the highest growth with Tampa (+31.8%), Miami (+31.7%), Dallas (+24.7%), Charlotte (+23.6%), Atlanta (+22.8%), Phoenix (+22.4%), Las Vegas (+21.8%) and San Diego (+16.6%) showing the fastest growth. In contrast, Minneapolis (+9.0%), Washington DC (+9.4%) and San Francisco (+10.8%) showed the slowest price growth. On a national level, Case-Shiller’s data showed home prices rising at a 15.8% annualized pace in July. However, when compared to the 18.1% pace seen in June, July’s print represents the largest month-to-month deceleration in the history of the index.
Home sales numbers continued to slide over the quarter as buyers grappled with rising interest rates. August’s data showed U.S. existing home sales fell for the seventh straight month to a 4.8 million annualized pace. The string of sales declines is the longest since the housing market crashed in 2007. The supply of homes for sale fell 1.5% to 1.28 million. At the current sales pace if would take 3.2 months to sell all the homes on the market, which while an increase from the 2.6 months seen in August last year, is still historically low.1 Realtors consider anything below five months of supply as indicative of a tight housing market. Bucking the trend, new home sales unexpectedly rose in August, rising 29% month-over-month to a 685,000 annualized pace. New home sales account for about 10% of the market and are counted when contracts are signed.1 They are considered a timelier barometer than purchases of existing homes, which are registered at closing. In our view, the uptick in new home sales may reflect an effort by buyers to avoid further increases in mortgage rates and take advantage of recent price cuts by builders. Home builder sentiment continues to drop, with the National Association of Home Builders sentiment index falling for the ninth straight month in September to 46. At the beginning of the year the index stood at 84 but sentiment has fallen every month since then, comprising the longest stretch of declines since 1985, as builders grapple with rising interest rates and construction costs. Builders reported using incentives like mortgage rate buydowns, free amenities and price reductions to boost sales numbers.
Chair Powell’s comments at the press conference subsequent to the September FOMC meeting were perceived as positive for mortgages as he appeared to rule out the sale of MBS from the Fed’s portfolio “…in the near term”. With interest rates at current levels, prepayments on the Fed’s MBS portfolio are likely to run well below the $35 billion reinvestment cap. In our view, with the Fed essentially out of the mortgage market for the time being and mortgage REITs generally deleveraging, money managers are the most likely source of future demand for MBS.
Portfolio Actions & Outlook: Over the course of the quarter we generally maintained our current exposure to RMBS across our 1-3 Year and longer strategies and reduced exposure in our shortest strategies. The reduction occurred due to prepayments, maturities and the exercise of a clean-up call by an issuer in the non-agency sector. We remain defensive and await greater clarity around the Fed’s path to reduce their portfolio before contemplating any increase in our MBS exposure. We continue to avoid adding to our non-agency holdings due to our concerns about extension risk and the lower liquidity of non-agencies during periods of heightened market volatility.
Performance: Our RMBS positions posted negative excess returns in our longer strategies and were flat in our shorter strategies. The relative outperformance of our shorter strategies was due mostly to the par clean-up call mentioned above that impacted a discount dollar-priced security. Our specified pool holdings were negative across all strategies in line with the overall market while our agency CMO positions were generally flat.
Municipals
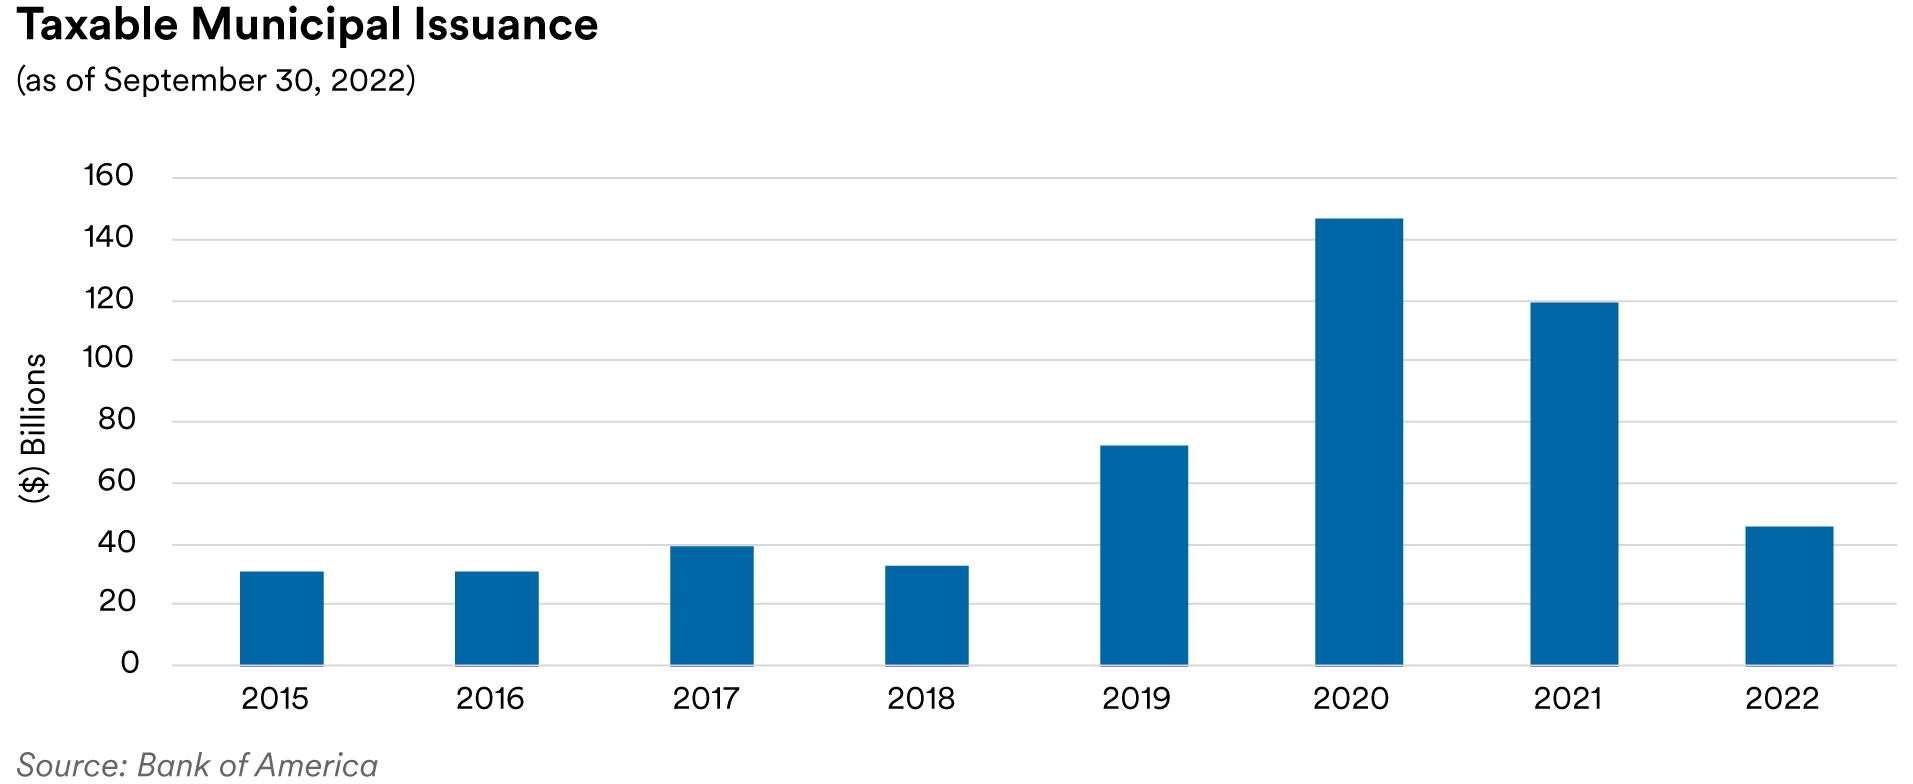
Recap: Total municipal new issue supply was $93.5 billion during the third quarter, a 26% decline from last year’s third quarter. The inability of issuers to advance refund their tax-exempt debt coupled with a higher interest rate environment were the catalysts for muted primary market activity with total refundings 65% lower compared to that of 2021’s third quarter. Overall, taxable municipals had negative absolute and excess returns during the third quarter. For the quarter, the ICE BofA 1-5 Year U.S. Taxable Municipal Securities Index total return was -2.66% versus the ICE BofA 1-5 Year U.S. Treasury Index total return of -2.28%. Taxable municipal underperformance was a result of spread widening as investor sentiment shifted on the heels of higher volatility and rising interest rates. Fund outflows were prevalent over the third quarter as market participants digested the everchanging macro landscape.
Strong credit fundamentals, however, drove positive ratings actions over the third quarter. Currently available data from S&P shows an upgrade to downgrade ratio of 2.7 to 1 for July and August. A few of our airport-related issuers were upgraded during the third quarter. For example, Chicago O’Hare Airport was upgraded by Fitch and S&P in August to A+ from A. The agency actions reflect improved fundamentals, demonstrated financial resiliency, and passenger traffic recovery. Positive enplanement trends and a strong overall enterprise risk profile were noted as catalysts for S&P upgrading Miami-Dade County Aviation to A from A- in August while also maintaining a positive outlook on the airport’s debt. In the healthcare space, Fitch upgraded our CommonSpirit Health holdings to A- from BBB+ in September. Fitch pointed to CommonSpirit’s substantial size, revenue and geographic diversity, and national scale which are expected to support management’s ability to build on fiscal 2021’s improvements in operating margin, efficient cost management, unrestricted cash, and liquidity levels. Also of note were state general obligation upgrades by Fitch including Michigan to AA from AA- in July, New Jersey to A from A- in September, and Ohio to AA+ from AA in September.
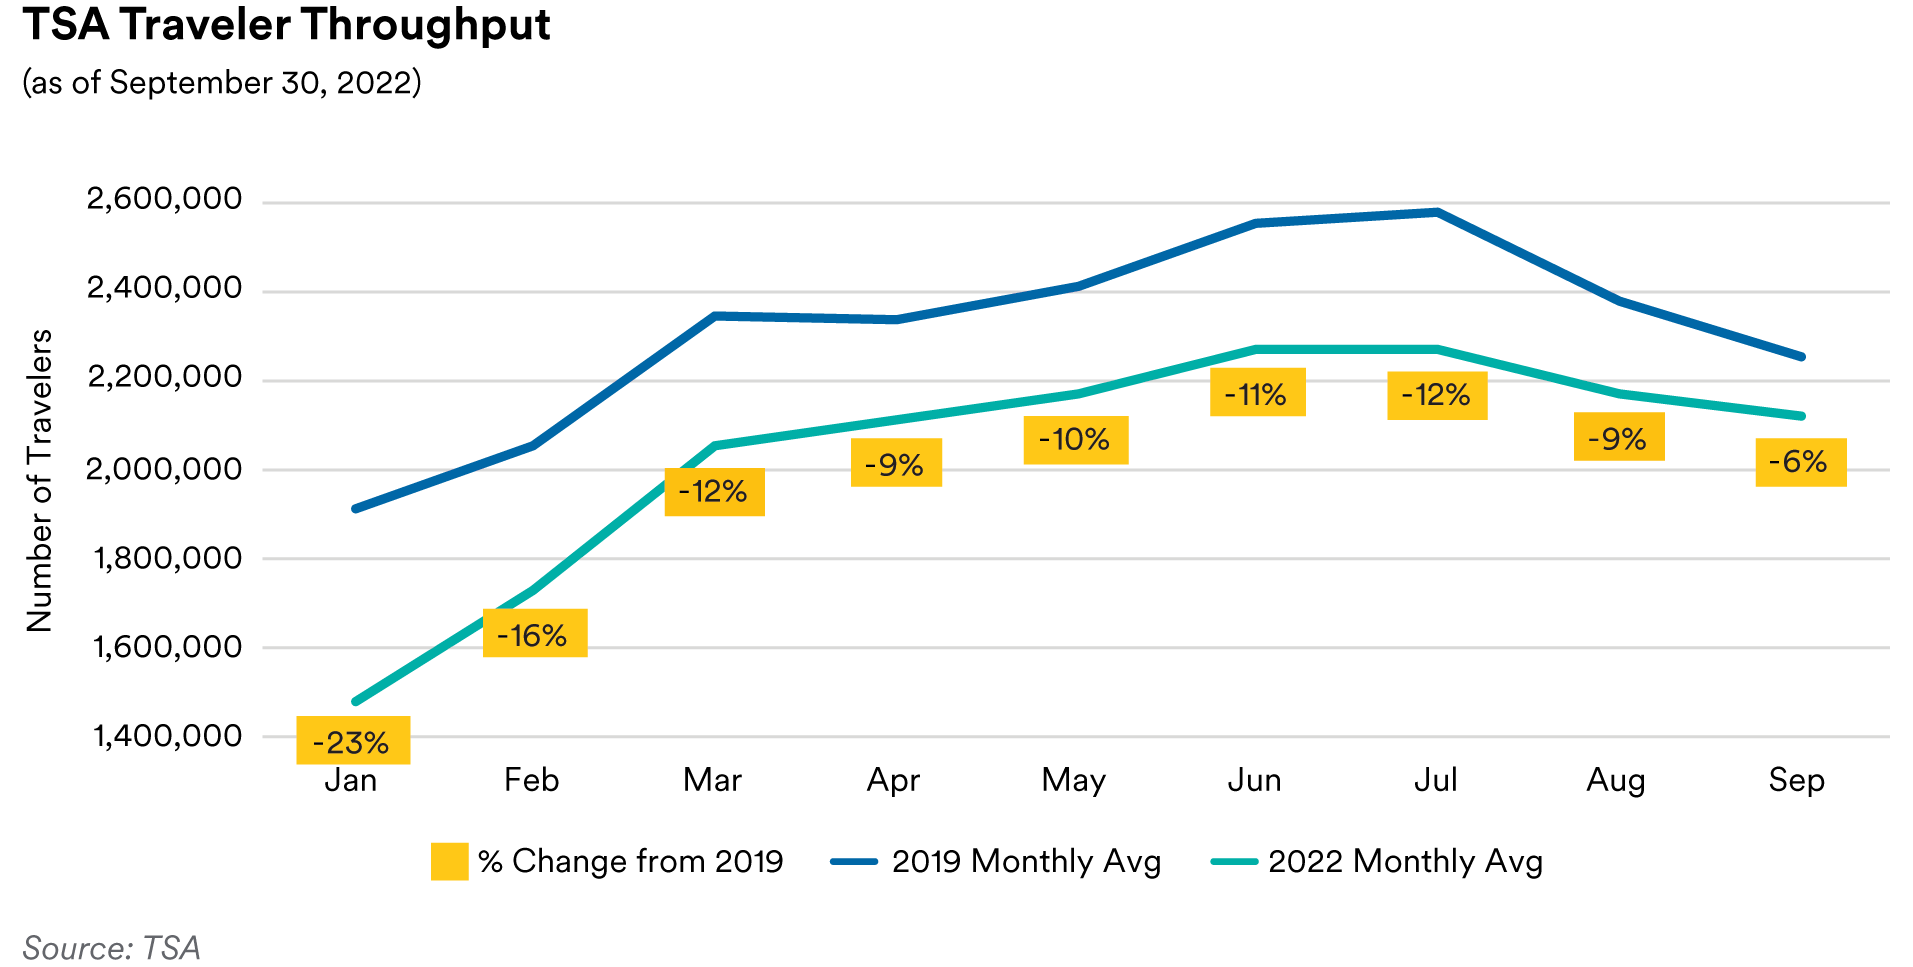
Portfolio Actions & Outlook: Our allocation to Taxable Municipals was maintained in our shorter duration strategies while we increased our weighting in our longer duration portfolios. Purchases in the portfolios continue to be defensively driven and were concentrated in higher-quality securities. We focused on state general obligation or tax-backed debt as well as transportation-related credits. Any reductions in our allocation were not related to credit concerns but based on relative value opportunities in other spread sectors; sales were primarily in securities with durations of under one year. We remain constructive in our outlook for state general obligation and related tax-backed debt. Even as we continue to experience positive ratings momentum, volatility in investment returns has increased pressure on pension funding levels. Milliman’s Public Pension Funding Index, comprised of the 100 largest U.S. public pension plans, decreased to 75.0% in August from 77.3% in July. Ongoing inflation and wage pressures, coupled with the potential for revenue growth moderation are likely to result in less budgetary flexibility, however estimated total fund balances of 25% at FYE 2022 should help mitigate the impact of these rising costs. Over the quarter we added to our holdings in the transportation sectors as travel demand, including from business and cruise-related passengers, continued to improve. On average for the third quarter, TSA throughput was only down 9% compared to 2019 levels. Despite increased oil and gas prices, traffic volumes have increased on year-to-date basis (through July) over each of the past few years. Data provided by the Federal Highway Administration shows 1.9 billion Vehicle Miles Traveled (VMT) as of July 2022, an overall increase of 0.3 billion VMT since July 2020.
We remained selective in our purchases in the healthcare sector over the quarter and continued to stick with a high-quality and low-duration investment strategy. Our focus remained on issuers with large market share, commitment to balance sheet strength and strong financial performance. Labor pressures have been a leading headwind for healthcare providers, driven by persistent staffing shortages. The Omicron surge and increased labor costs negatively impacted margins during the first quarter which improved during the second quarter. Further modest margin repair is expected in the second half of 2022 as the use of contract labor recedes. We expect that the recoupment of any remaining margin losses will occur slowly in 2023-24 as hospitals improve productivity or cut costs to offset higher compensation required to retain core nursing staff along with increased supply and purchased services expenses.
Performance: Our Taxable Municipal holdings generated mixed performance across our strategies in the third quarter. On an excess return basis, the sector was a positive contributor in our longer duration strategies and detracted slightly from, or were neutral to, performance in our shorter duration strategies. Holdings in airports and tax-backed issuers generated positive excess returns while detractors included select holdings in highway bonds and one transportation bond.
Endnote
1 All market data and statistics have been sourced from ICE Data Services, Capital IQ, RCA CPPI, Transportation Security Administration, Bloomberg, J.P. Morgan and Bank of America.”
Disclaimers
This material is intended solely for Institutional Investors, Qualified Investors and Professional Investors. This analysis is not intended for distribution with Retail Investors. This document has been prepared by MetLife Investment Management (“MIM”)1 solely for informational purposes and does not constitute a recommendation regarding any investments or the provision of any investment advice, or constitute or form part of any advertisement of, offer for sale or subscription of, solicitation or invitation of any offer or recommendation to purchase or subscribe for any securities or investment advisory services. The views expressed herein are solely those of MIM and do not necessarily reflect, nor are they necessarily consistent with, the views held by, or the forecasts utilized by, the entities within the MetLife enterprise that provide insurance products, annuities and employee benefit programs. The information and opinions presented or contained in this document are provided as of the date it was written. It should be understood that subsequent developments may materially affect the information contained in this document, which none of MIM, its affiliates, advisors or representatives are under an obligation to update, revise or affirm. It is not MIM’s intention to provide, and you may not rely on this document as providing, a recommendation with respect to any particular investment strategy or investment. Affiliates of MIM may perform services for, solicit business from, hold long or short positions in, or otherwise be interested in the investments (including derivatives) of any company mentioned herein. This document may contain forward-looking statements, as well as predictions, projections and forecasts of the economy or economic trends of the markets, which are not necessarily indicative of the future. Any or all forward-looking statements, as well as those included in any other material discussed at the presentation, may turn out to be wrong.
All investments involve risks including the potential for loss of principle and past performance does not guarantee similar future results.
In the U.S. this document is communicated by MetLife Investment Management, LLC (MIM, LLC), a U.S. Securities Exchange Commission registered investment adviser. MIM, LLC is a subsidiary of MetLife, Inc. and part of MetLife Investment Management. Registration with the SEC does not imply a certain level of skill or that the SEC has endorsed the investment advisor.
This document is being distributed by MetLife Investment Management Limited (“MIML”), authorised and regulated by the UK Financial Conduct Authority (FCA reference number 623761), registered address 1 Angel Lane, 8th Floor, London, EC4R 3AB, United Kingdom. This document is approved by MIML as a financial promotion for distribution in the UK. This document is only intended for, and may only be distributed to, investors in the UK and EEA who qualify as a “professional client” as defined under the Markets in Financial Instruments Directive (2014/65/EU), as implemented in the relevant EEA jurisdiction, and the retained EU law version of the same in the UK.
MIMEL: For investors in the EEA, this document is being distributed by MetLife Investment Management Europe Limited (“MIMEL”), authorised and regulated by the Central Bank of Ireland (registered number: C451684), registered address 20 on Hatch, Lower Hatch Street, Dublin 2, Ireland. This document is approved by MIMEL as marketing communications for the purposes of the EU Directive 2014/65/EU on markets in financial instruments (“MiFID II”). Where MIMEL does not have an applicable cross-border license, this document is only intended for, and may only be distributed on request to, investors in the EEA who qualify as a “professional client” as defined under MiFID II, as implemented in the relevant EEA jurisdiction.
For investors in the Middle East: This document is directed at and intended for institutional investors (as such term is defined in the various jurisdictions) only. The recipient of this document acknowledges that (1) no regulator or governmental authority in the Gulf Cooperation Council (“GCC”) or the Middle East has reviewed or approved this document or the substance contained within it, (2) this document is not for general circulation in the GCC or the Middle East and is provided on a confidential basis to the addressee only, (3) MetLife Investment Management is not licensed or regulated by any regulatory or governmental authority in the Middle East or the GCC, and (4) this document does not constitute or form part of any investment advice or solicitation of investment products in the GCC or Middle East or in any jurisdiction in which the provision of investment advice or any solicitation would be unlawful under the securities laws of such jurisdiction (and this document is therefore not construed as such).
For investors in Japan: This document is being distributed by MetLife Asset Management Corp. (Japan) (“MAM”), 1-3 Kioicho, Chiyodaku, Tokyo 102-0094, Tokyo Garden Terrace KioiCho Kioi Tower 25F, a registered Financial Instruments Business Operator (“FIBO”) under the registration entry Director General of the Kanto Local Finance Bureau (FIBO) No. 2414.
For Investors in Hong Kong S.A.R.: This document is being issued by MetLife Investments Asia Limited (“MIAL”), a part of MIM, and it has not been reviewed by the Securities and Futures Commission of Hong Kong (“SFC”). MIAL is licensed by the Securities and Futures Commission for Type 1 (dealing in securities), Type 4 (advising on securities) and Type 9 (asset management) regulated activities.
For investors in Australia: This information is distributed by MIM LLC and is intended for “wholesale clients” as defined in section 761G of the Corporations Act 2001 (Cth) (the Act). MIM LLC exempt from the requirement to hold an Australian financial services license under the Act in respect of the financial services it provides to Australian clients. MIM LLC is regulated by the SEC under US law, which is different from Australian law.
1 MetLife Investment Management (“MIM”) is MetLife, Inc.’s institutional management business and the marketing name for subsidiaries of MetLife that provide investment management services to MetLife’s general account, separate accounts and/or unaffiliated/third party investors, including: Metropolitan Life Insurance Company, MetLife Investment Management, LLC, MetLife Investment Management Limited, MetLife Investments Limited, MetLife Investments Asia Limited, MetLife Latin America Asesorias e Inversiones Limitada, MetLife Asset Management Corp. (Japan), and MIM I LLC and MetLife Investment Management Europe Limited.
Unless otherwise noted, none of the authors of the articles on this page are regulated in Ireland.