Looking ahead, ‘debt overhang’ may act as an on-going economic headwind to GDP and productive capacity. As government debt servicing costs rise as a percentage of GDP, political tensions could rise further especially given the rapidly shifting geopolitical landscape. The shift in the cost of capital may also impact business decisions, R&D, social spending, government deficits, supply and demand of securities, the shape of the yield curve and central bank policy decision making.
Our ongoing series “A World in Debt” will delve into the enormity of aggregate global debt and its potential impacts in the coming years. While certain outcomes can be anticipated, others may surprise us. Understanding the dynamics of these absolute and relative debt levels will be crucial for discerning investors, as it will inevitably create winners and losers. The series will kick off with an examination of the U.S. Treasury market and be subsequently followed by in-depth analysis of the corporate, emerging markets, and consumer debt sectors. Stay tuned for insights that could help shape your investment strategies in the years ahead
Introduction
The COVID pandemic brought on a wave of government stimulus spending and pushed the global public debt-to-GDP ratio above 100%.1 U.S. debt is now also roughly as large as its GDP and, given expectations of increased borrowing needs in the future, U.S. Treasury bond supply will likely grow larger.
At the same time, the demand for Treasuries is undergoing several changes. The rating downgrade combined with possible future downgrades, greater scrutiny on the fiscal process, concerns about the possibility of sanctions placed on foreign governments, and changes in the composition of Treasury holders are all evolving factors to which market participants and bond holders will continue to adapt.
Supply Side Growth: U.S. Treasury Supply
We expect net Treasury issuance to continue to be over $2 trillion annually, four times the pre-pandemic (1996-2019) average of around $500 billion.
As we discussed in our previous paper on U.S. debt, federal revenues have been largely range-bound over history at 15-20% of nominal GDP, while government outlays have historically been more volatile.
Since the Great Financial Crisis, primary deficits have risen, as Congressional Budget Office (CBO) data show that the primary deficit before 2008 averaged 1.1% but after 2008 it averaged 4.7%.
 The persistent deficit has pushed gross U.S. debt- to-GDP to over 110%, far above the median 49% of other countries Fitch rates as AA.2 Recently higher rates have also pushed up the cost of debt rollover and interest payments, and the U.S.’ interest-to- revenue ratio of over 13% is more akin to a BBB- rated sovereign rather than a high-rated developed market economy. Moreover, unavoidable cost pressures from nondiscretionary outlays such as Social Security, Medicare, and Medicaid from cost- of-living price adjustments and an increase in the number of retirees mean that the debt trajectory will increase in virtually all plausible scenarios. Interest payments would increase further as the Fed rolls off Treasuries from its balance sheet.3
Growth alone without fiscal action will not be enough to materially alter the path of the debt. Our model finds that one percentage point of real GDP growth would decrease public debt-to-GDP by just 0.3%, but one percentage point of government surplus would decrease it by 1.1%.
The Treasury department seeks to be a regular and predictable market participant in addition to seeking to minimize costs over time (See box entitled Treasury Financing Goals). The policy makes government funding more transparent to the public, and the effort at consistency combined with the relatively stable nature of government expenses makes the supply side of the Treasury market somewhat more predictable
All in all, increased borrowing needs, increased interest payments, and changes in Fed and foreign demand (which we will discuss further below) means we will likely see a growing supply of Treasury issuance available to investors over the coming years.
Supply Side Changes: Productivity Alone Can’t Rescue the Fiscal State
The current situation is in some ways comparable to the debt situation of the early 1990s, when the government debt had also ballooned. In that case, by the late 1990s, the U.S. managed to produce a budget surplus and even faced the possibility of a shortfall of Treasury issuance. This was achieved through a combination of political cooperation and high productivity growth.
It is possible that we could see high productivity growth in the medium term from developments in AI.4 Political cooperation was also difficult in the early 1990s, if not quite as difficult as today. However, the fiscal situation today is somewhat more difficult, starting as from a higher debt-to-GDP ratio. Rising nondiscretionary spending is more difficult to address than discretionary, and geopolitical concerns are rising rather than declining as they were in the 1990s. As in the 1990s, the U.S. needs both political cooperation and rapid productivity growth to improve its fiscal position.
Demand Side Reconfiguration
The global demand for sovereign bonds in the form of reserve assets has plateaued in the past decade. China and other Asian countries have reduced their reserves holdings and global trade growth has decelerated with the rise of protectionism.
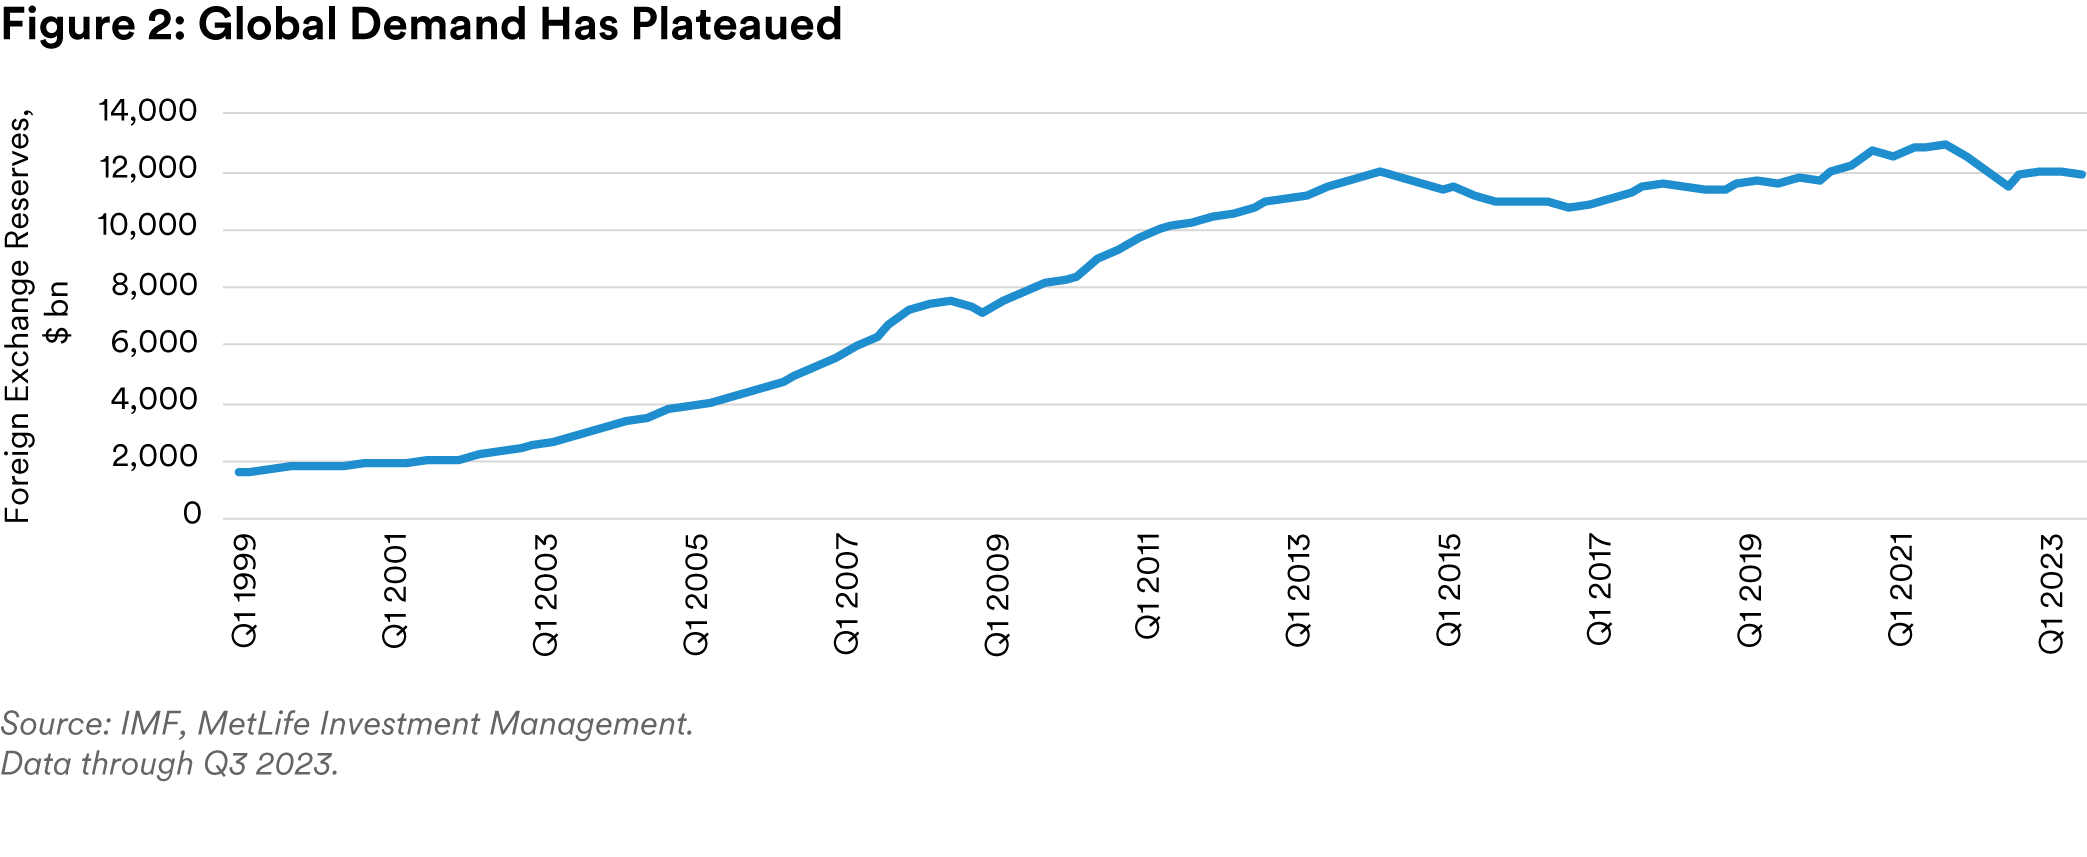
Going forward, we expect these trends to continue, and demand to remain flat going forward. As a result, we expect absorption of U.S. Treasuries to be dependent on domestic holders. This includes both households, a more price-sensitive group than the foreign institutional holders they are replacing, as well as mutual funds, banks and other institutions.
To implement the details of this strategy, the Treasury takes into account deficit needs, Treasury market demand and expectations, and overall market intelligence from its own research, primary dealer firms, and members of the Treasury Borrowing Advisory Committee in its Quarterly Refunding process
Source: U.S. Department of Treasury, Office of Debt Management
Demand for U.S. Treasuries
The buyers of Treasury bonds can be roughly categorized into five broad groups: foreign holders, households, the Federal Reserve, funds such as mutual funds and ETFs, and other holders such as insurance companies and banks.
Broadly, demand for Treasuries is shifting from external holders to domestic, and from stable holders like foreign central banks to more price sensitive holders like households.
Foreign Demand
Foreign holdings have shrunk as a share of total Treasuries issued.
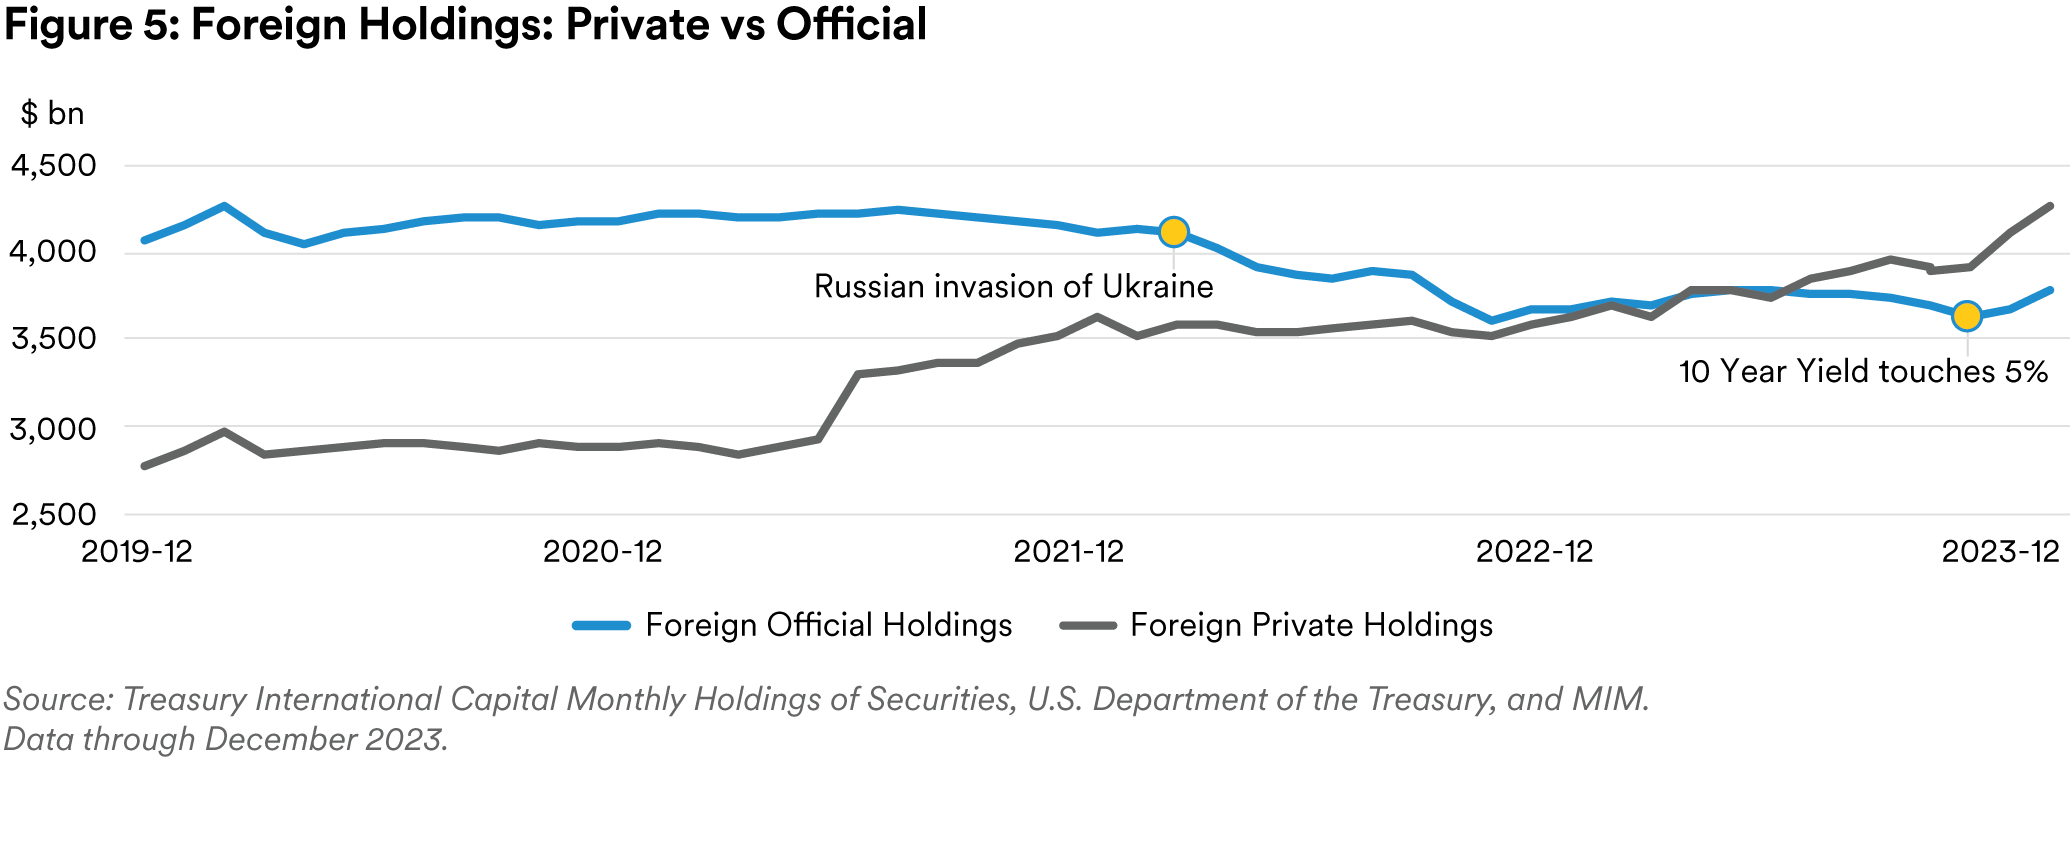
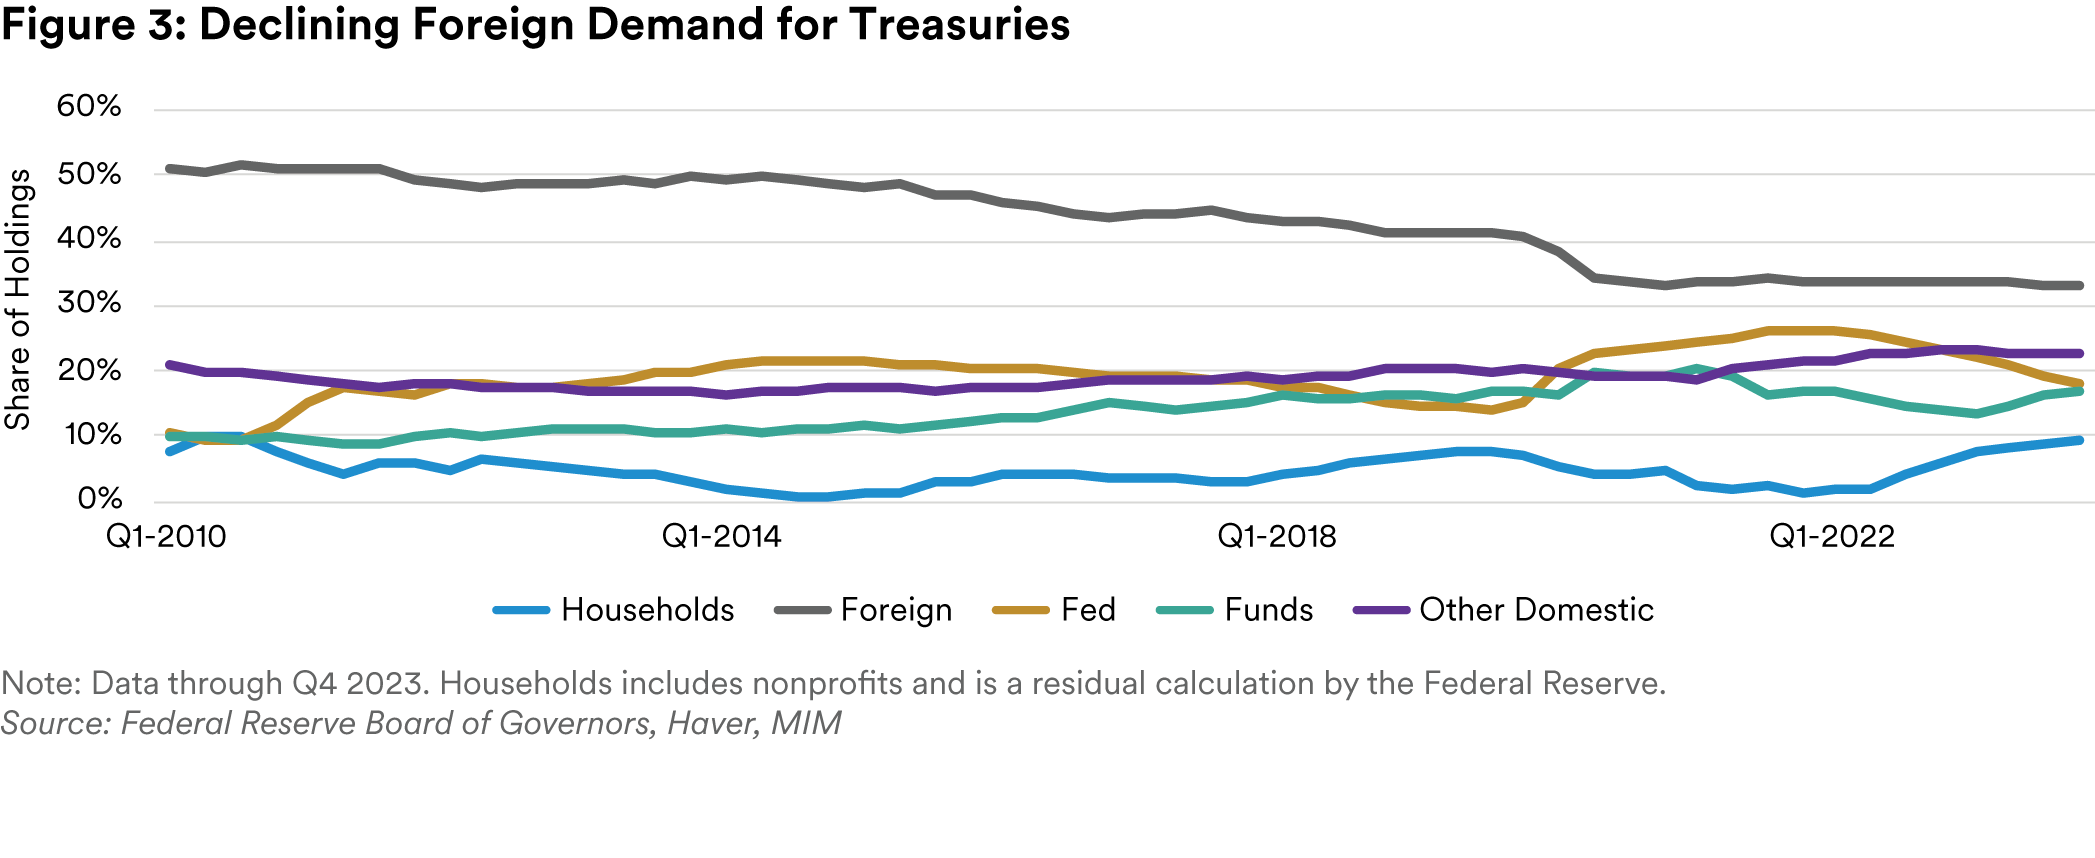 Some of this reflects the global trend of holding fewer Treasury reserves as noted above. However, some part also appears to be official reserves rebalancing away from U.S. Treasuries. Official holdings have fallen in recent years—particularly after the Russian invasion of Ukraine and the subsequent sanctions placed on Russia, as countries responded to sanctions risks. There have been some countervailing shifts in private holdings which partly offset those decreases.

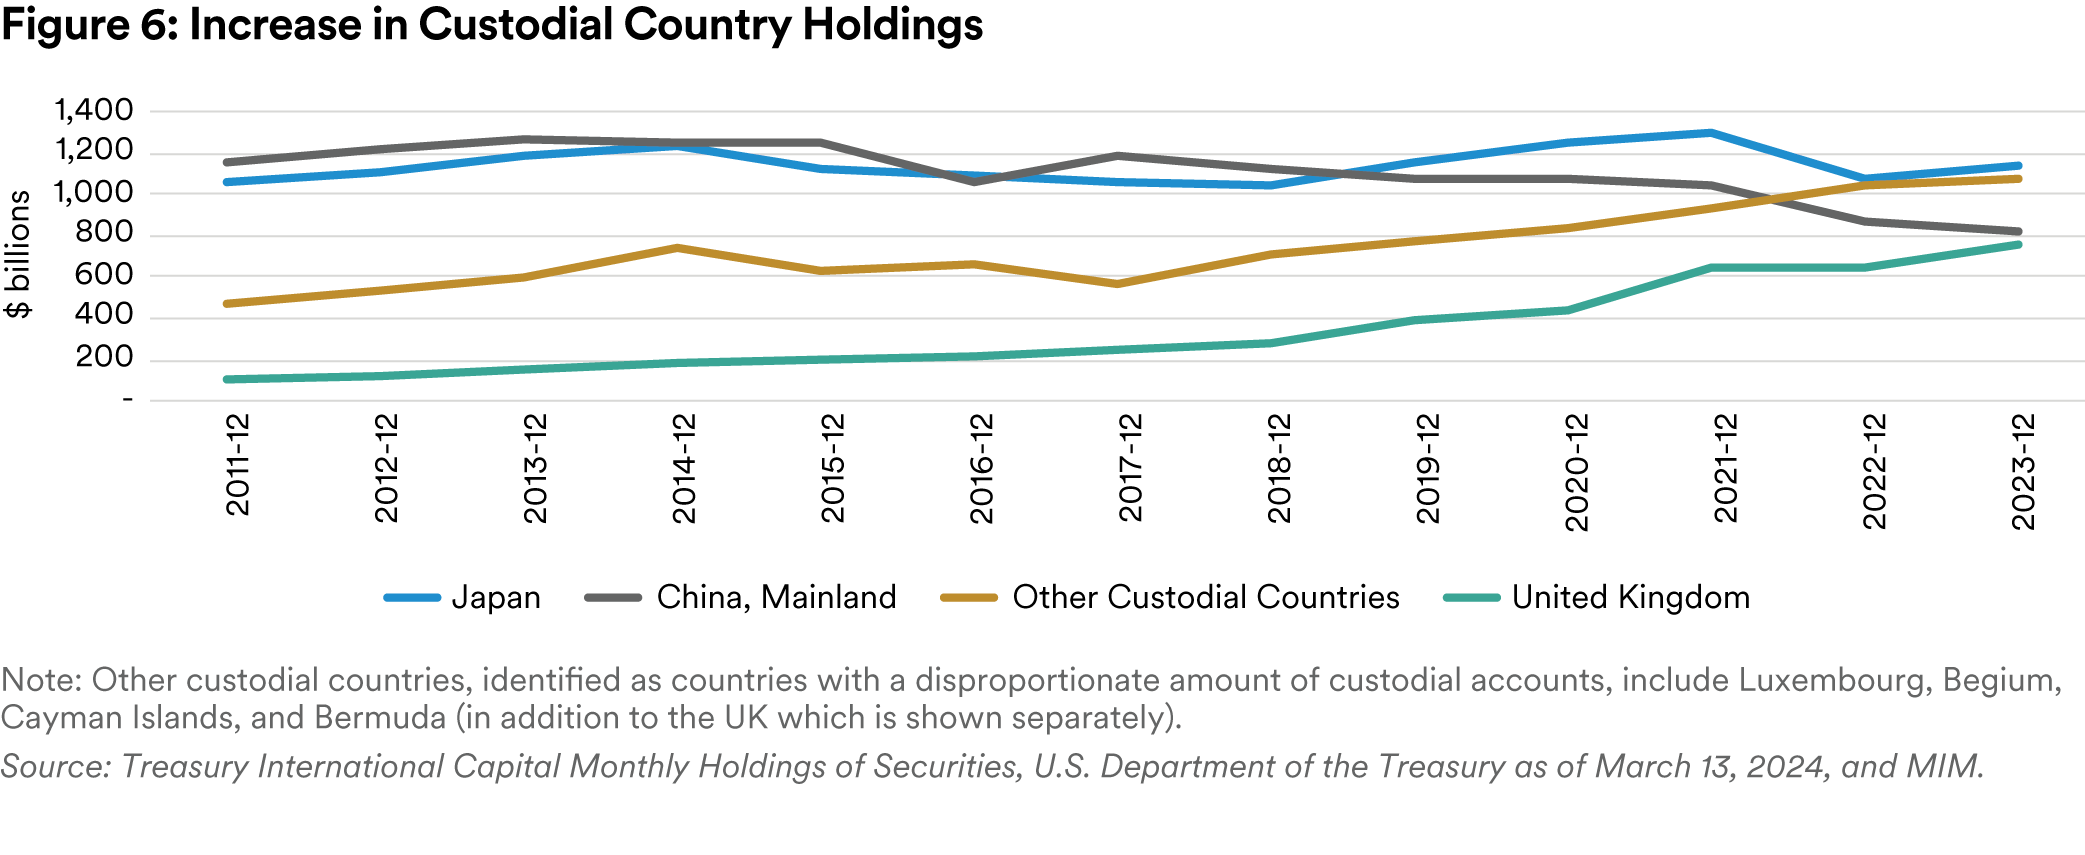
 Looking at foreign holdings by country (combining official and private), we see further indications that countries may be moving defensively to protect their holdings against sudden U.S. policy changes. The biggest movers in the last five years—by far—have been China and the United Kingdom (see Figure 6). The UK is considered a custodial country, and holdings of dollar reserves in custodial countries have seen a sharp increase in the last four years.5 These countries hold assets on behalf of their owners in third countries. One explanation of this is that foreign holders have retained their dollar assets but have shifted them to custodial countries that may provide more favorable treatment than the U.S. should there be sanctions or other adverse actions.
The Federal Reserve
In the years following the Great Financial Crisis (GFC) the Federal Reserve has been an increasingly important actor in the U.S. Treasury market. Since the advent of Quantitative Easing during the GFC, the Federal Reserve has boosted their holdings of U.S. Treasury Securities. In doing so, we see that the Federal Reserve creates five impacts on the Treasury market, either directly or indirectly:
- There is the direct impact of increasing demand for Treasury debt.
- As debt is purchased the Federal Reserve holds more debt that can be lent into the repurchase agreement market. Since there are limits on this lending, it may reduce the overall liquidity in Treasury market financing supply.
- Portfolio income that is not spent on operations by the Federal Reserve is remitted back to the U.S. Treasury—meaning the effective interest rate paid by the government on those securities is near zero.
- The purchase of debt is financed by the creation of new money, which has the potential to increase inflation and impact Treasury yields over time.
- Rollovers are additional easing. Even though the dollar amount of the portfolio is constant, the amount of duration risk removed from the market does change as the Federal Reserve rolls maturing debt into longer-dated securities.
Pre-GFC Federal Reserve holdings of Treasury debt were roughly $750bn, or 17% of the outstanding Treasury supply (at the end of 2007). As the crisis unfolded, Treasury Holdings were initially reduced, falling to about $475bn, before the Federal Reserve embarked on Quantitative Easing. As the Fed began to add to their holdings of Treasury Securities, they expanded their holdings on both an absolute and a relative (to overall Treasury supply) basis. The Treasury portfolio reached its peak in June 2022 at roughly $5,800bn, 25% of the outstanding Treasury supply. Since that time, the portfolio has continued to shrink as the Federal Reserve began the process of Quantitative Tightening or the process of allowing Treasury debt to mature and roll of the balance sheet. This process reduces the Federal Reserve’s holdings by up to $25bn per month. As of the end of 2023 the Federal Reserve still held $4.8 trillion in Treasury debt, an amount equal to the pre-GFC holdings as a percentage of the amount outstanding.
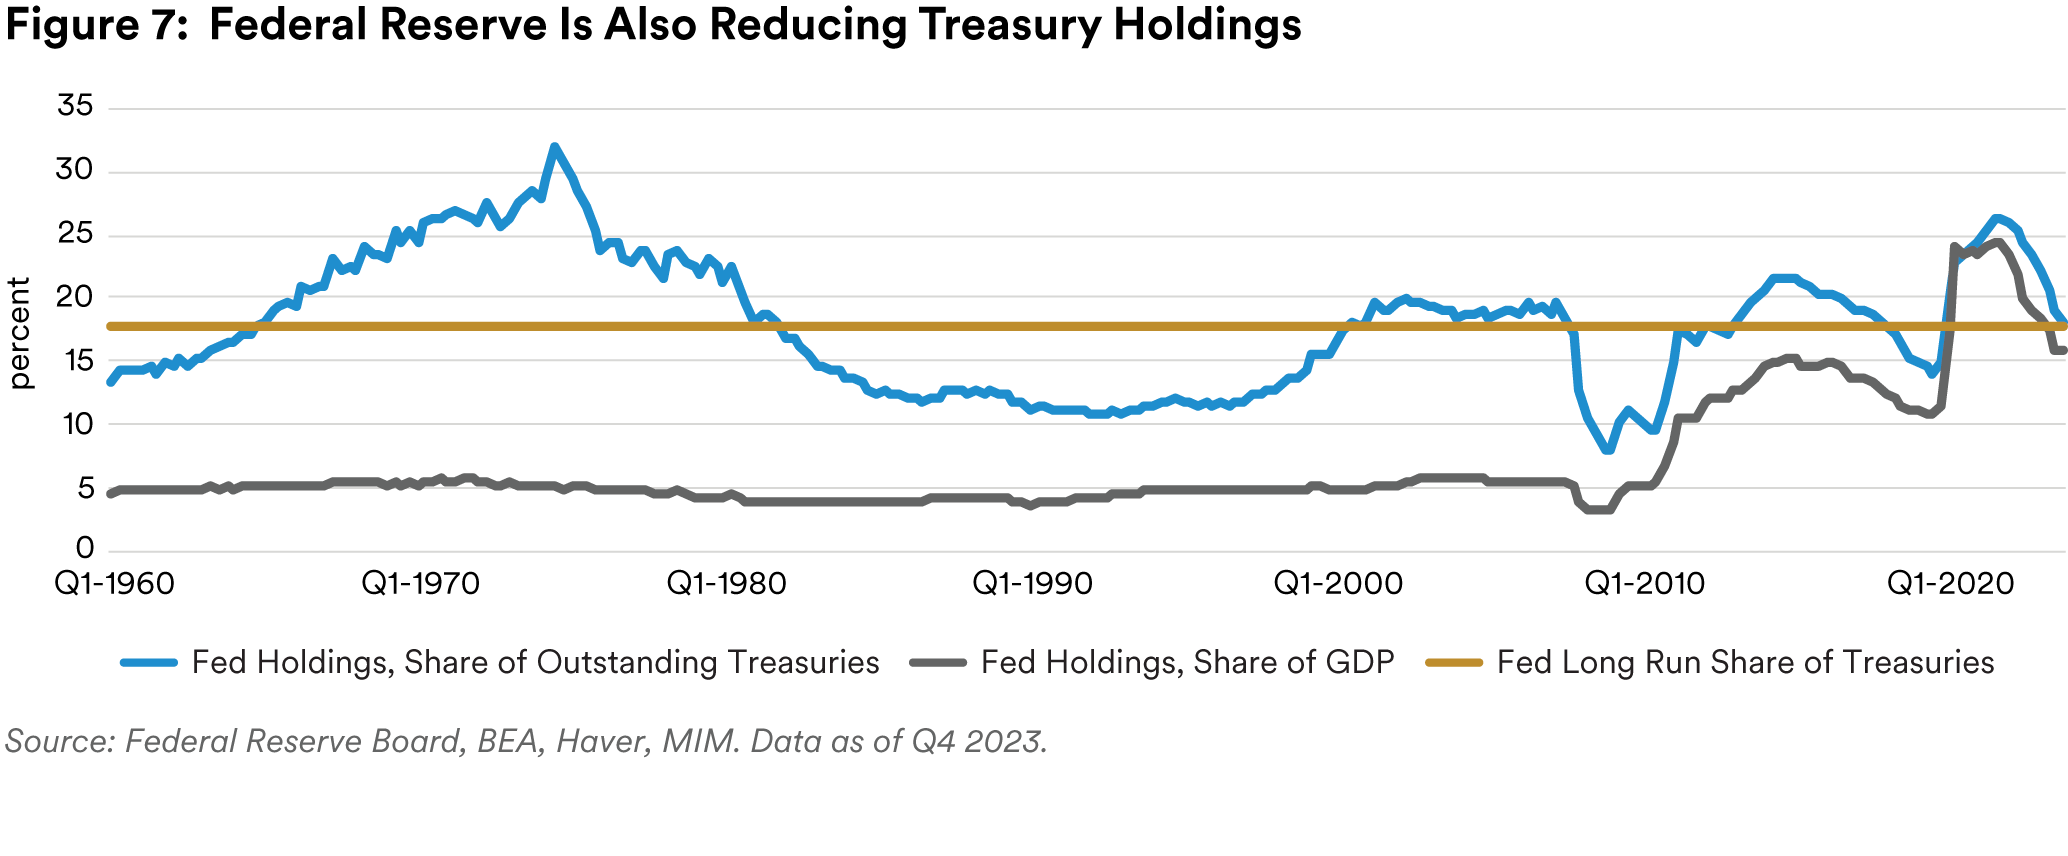
To continue normalizing the balance sheet in composition, the Federal Reserve will need to continue to manage a longer-term process of reducing mortgage-backed securities (MBS) holdings through run-off and replacing them with Treasury Securities. The run-off of the MBS portfolio is slow and expected to continue to remain slow as high interest rates have dramatically reduced prepayments.
At the current run rate, Quantitative Tightening would continue through 2025, although the exact path would depend on the evolution of GDP growth and Treasury market liquidity conditions.
Households and Others
Relative to recent history, the share of Treasury bonds held by households is increasing. Households are currently holding $2.4 trillion6 in Treasuries—the most ever, even in real terms. However, domestic households are a more volatile group of lenders as their Treasury holdings fluctuate. When alternatives to Treasuries are in favor (e.g. housing in the mid- 2000s) or when real yields are high (since 2022), households tend to change their holdings of Treasuries quite abruptly..
Importantly, households also engage with the U.S. Treasury through funds—primarily mutual funds and ETFs—as well as more indirectly via life insurance products, pensions, and the banking sector. Treasury holdings via banks and funds have been much less volatile: a Treasury bond fund held within a 401(k), say, appears less likely to be traded based on changing market conditions.
We should expect households to reduce purchases or exit the Treasury market when real rates fall or when other sectors become relatively more attractive.
Implications of Demand Side Changes
We see most indicators pointing to plateauing or even declining U.S. Treasury global reserves going forward. We do not expect the U.S. to regain its dominance of foreign exchange holdings from the 2000s as countries are likely to continue to diversify their reserves or reduce them altogether. The improved liquidity of so-called “nontraditional reserve currencies” (e.g. Canadian dollars, Australian dollars) could mean that countries rebalance their holdings marginally toward those currencies.
Further, we would expect more shifts to custodial countries—where the holdings cannot be tied back to their ultimate owners. We expect these shifts to persist with geopolitical uncertainty.
However, there are limits to this process. There remains an overwhelming need to have and use dollars for trade invoicing, debt issuance, and liquidity. Holdings can only be reduced at the margins. There is even some evidence to suggest that geopolitical rivals to the U.S. may need to hold more—rather than less—dollar assets to protect against liquidity issues should they come up against U.S. sanctions.7
Looking forward, we expect global reserves holdings to continue to plateau, if not fall. The catalysts for the run-up in global reserves—the Asian Financial Crisis and the rise of China as a trading powerhouse—have played themselves out or matured. Further, as we noted in a prior article, we expect deglobalization, and decelerating trade to continue. We would expect this to decrease relative demand for US Treasuries. Greater liquidity of alternatives to reserve management securities such as sovereign debt from Canada and Australia, provides diversification opportunities to U.S. Treasuries.
Conclusion: Yields and Investment Implications
What will the Treasury market look like going forward?
On the supply side, we expect larger U.S. net issuances (over $2 trillion annually versus $0.5 trillion pre-pandemic) through the medium term. Persistent deficit spending, structural cost pressures from mandatory programs like Social Security and Medicare, and the Fed shrinking its balance sheet mean that more Treasuries would have to be absorbed by investors. Other spending priorities are mounting, including climate change adaptation, energy transition, supply chain reconfiguration, greater defense spending, and increased industrial policy intervention.
On the demand side, certain countries appear to have become more reticent to stockpile large reserves holdings, and have reallocated reserves away from the U.S., while more price-sensitive buyers have increased their share of Treasury holdings. We expect these shifts in demand to continue as deglobalization, improved financial markets outside the U.S., and geopolitical worries present global funds with alternatives to U.S. Treasuries.
We expect these changes to lead to higher yields than has occurred in the past several decades, as supply rises relative to demand. We also expect higher volatility and cyclicality as domestic buyers that are more price- sensitive and sensitive to business cycles supplant less price-sensitive and less cyclical foreign buyers.
Treasury Financing Goals
A critical Treasury Department objective is to fund the government at the least cost to the taxpayer over time. But the Treasury is too large to behave opportunistically in the market: it is subject to legislative and economic uncertainty, and changing borrowing needs (rollovers, budget deficits, and desired government cash balance changes). Given this operating environment, the Treasury employs a funding strategy with the following benefits
- Least expected cost over time—there is no need to react to short-term rate levels or demand fluctuations.
- Regular and predictable auctions—more transparency to the public and other market participants, with no need to manage market timing.
- More flexibility to raise cash, pay down debt, and respond to legislative uncertainty—the Treasury may use shorter maturity debt even if it is more expensive in the short-run.
To implement the details of this strategy, the Treasury takes into account deficit needs, Treasury market demand and expectations, and overall market intelligence from its own research, primary dealer firms, and members of the Treasury Borrowing Advisory Committee in its Quarterly Refunding process
Source: U.S. Department of Treasury, Office of Debt Management
Endnotes
1 IMF Global Debt Monitor 2023.
2 Debt held by the public was 97.3% of GDP in 2023. CBO’s Baseline Projections of Federal Debt, Table 1-3, February 2024.
3 When the Federal Reserve holds Treasuries, it remits excess interest payments back to the Treasury, making borrowing effectively free.
4 See our paper on productivity growth.
5 Custodial countries include Switzerland, as well as the UK, Belgium, the Cayman Islands, and the Bahamas. These countries hold assets on behalf of third countries, whose foreign holdings may therefore be underweighted in Treasury records. “Understanding U.S. Cross-Border Securities Data,” Federal Reserve Bulletin, February 2009.
6 Federal Reserve Flow of Funds as of June 2024.
7 Goldberg, Linda S., and Oliver Hannaoui, “Drivers of Dollar Share in Foreign Exchange Reserves,” Staff Report No. 1087, Federal Reserve Bank of New York, March 2024.
Disclaimer
This material is intended solely for Institutional Investors, Qualified Investors and Professional Investors. This analysis is not intended for distribution with Retail Investors.
This document has been prepared by MetLife Investment Management (“MIM”)1 solely for informational purposes and does not constitute a recommendation regarding any investments or the provision of any investment advice, or constitute or form part of any advertisement of, offer for sale or subscription of, solicitation or invitation of any offer or recommendation to purchase or subscribe for any securities or investment advisory services.
The views expressed herein are solely those of MIM and do not necessarily reflect, nor are they necessarily consistent with, the views held by, or the forecasts utilized by, the entities within the MetLife enterprise that provide insurance products, annuities and employee benefit programs. The information and opinions presented or contained in this document are provided as of the date it was written. It should be understood that subsequent developments may materially affect the information contained in this document, which none of MIM, its affiliates, advisors or representatives are under an obligation to update, revise or affirm. It is not MIM’s intention to provide, and you may not rely on this document as providing, a recommendation with respect to any particular investment strategy or investment. Affiliates of MIM may perform services for, solicit business from, hold long or short positions in, or otherwise be interested in the investments (including derivatives) of any company mentioned herein.This document may contain forward-looking statements, as well as predictions, projections and forecasts of the economy or economic trends of the markets, which are not necessarily indicative of the future. Any or all forward-looking statements, as well as those included in any other material discussed at the presentation, may turn out to be wrong..
All investments involve risks including the potential for loss of principle and past performance does not guarantee similar future results. Property is a specialist sector that may be less liquid and produce more volatile performance than an investment in other investment sectors. The value of capital and income will fluctuate as property values and rental income rise and fall. The valuation of property is generally a matter of the valuers’ opinion rather than fact. The amount raised when a property is sold may be less than the valuation. Furthermore, certain investments in mortgages, real estate or non-publicly traded securities and private debt instruments have a limited number of potential purchasers and sellers. This factor may have the effect of limiting the availability of these investments for purchase and may also limit the ability to sell such investments at their fair market value in response to changes in the economy or the financial markets.
In the U.S. this document is communicated by MetLife Investment Management, LLC (MIM, LLC), a U.S. Securities Exchange Commission registered investment adviser. MIM, LLC is a subsidiary of MetLife, Inc. and part of MetLife Investment Management. Registration with the SEC does not imply a certain level of skill or that the SEC has endorsed the investment advisor.
This document is being distributed by MetLife Investment Management Limited (“MIML”), authorised and regulated by the UK Financial Conduct Authority (FCA reference number 623761), registered address 1 Angel Lane, 8th Floor, London, EC4R 3AB, United Kingdom. This document is approved by MIML as a financial promotion for distribution in the UK. This document is only intended for, and may only be distributed to, investors in the UK and EEA who qualify as a “professional client” as defined under the Markets in Financial Instruments Directive (2014/65/EU), as implemented in the relevant EEA jurisdiction, and the retained EU law version of the same in the UK.
For investors in the Middle East: This document is directed at and intended for institutional investors (as such term is defined in the various jurisdictions) only. The recipient of this document acknowledges that (1) no regulator or governmental authority in the Gulf Cooperation Council (“GCC”) or the Middle East has reviewed or approved this document or the substance contained within it, (2) this document is not for general circulation in the GCC or the Middle East and is provided on a confidential basis to the addressee only, (3) MetLife Investment Management is not licensed or regulated by any regulatory or governmental authority in the Middle East or the GCC, and (4) this document does not constitute or form part of any investment advice or solicitation of investment products in the GCC or Middle East or in any jurisdiction in which the provision of investment advice or any solicitation would be unlawful under the securities laws of such jurisdiction (and this document is therefore not construed as such).
For investors in Japan: This document is being distributed by MetLife Investment Management Japan, Ltd. (“MIM JAPAN”) a registered Financial Instruments Business Operator (“FIBO”) under the registration entry Director General of the Kanto Local Finance Bureau (FIBO) No. 2414, a regular member of the Japan Investment Advisers Association and the Type II Financial Instruments Firms Association of Japan. As fees to be borne by investors vary depending upon circumstances such as products, services, investment period and market conditions, the total amount nor the calculation methods cannot be disclosed in advance. All investments involve risks including the potential for loss of principle and past performance does not guarantee similar future results. Investors should obtain and read the prospectus and/or document set forth in Article 37-3 of Financial Instruments and Exchange Act carefully before making the investments.
For Investors in Hong Kong S.A.R.: This document is being issued by MetLife Investments Asia Limited (“MIAL”), a part of MIM, and it has not been reviewed by the Securities and Futures Commission of Hong Kong (“SFC”). MIAL is licensed by the Securities and Futures Commission for Type 1 (dealing in securities), Type 4 (advising on securities) and Type 9 (asset management) regulated activities.
For investors in Australia: This information is distributed by MIM LLC and is intended for “wholesale clients” as defined in section 761G of the Corporations Act 2001 (Cth) (the Act). MIM LLC exempt from the requirement to hold an Australian financial services license under the Act in respect of the financial services it provides to Australian clients. MIM LLC is regulated by the SEC under US law, which is different from Australian law.
MIMEL: For investors in the EEA, this document is being distributed by MetLife Investment Management Europe Limited (“MIMEL”), authorised and regulated by the Central Bank of Ireland (registered number: C451684), registered address 20 on Hatch, Lower Hatch Street, Dublin 2, Ireland. This document is approved by MIMEL as marketing communications for the purposes of the EU Directive 2014/65/EU on markets in financial instruments (“MiFID II”). Where MIMEL does not have an applicable cross-border licence, this document is only intended for, and may only be distributed on request to, investors in the EEA who qualify as a “professional client” as defined under MiFID II, as implemented in the relevant EEA jurisdiction. The investment strategies described herein are directly managed by delegate investment manager affiliates of MIMEL. Unless otherwise stated, none of the authors of this article, interviewees or referenced individuals are directly contracted with MIMEL or are regulated in Ireland. Unless otherwise stated, any industry awards referenced herein relate to the awards of affiliates of MIMEL and not to awards of MIMEL.
1 As of December 31, 2023, subsidiaries of MetLife, Inc. that provide investment management services to MetLife’s general account, separate accounts and/ or unaffiliated/third party investors include Metropolitan Life Insurance Company, MetLife Investment Management, LLC, MetLife Investment Management Limited, MetLife Investments Limited, MetLife Investments Asia Limited, MetLife Latin America Asesorias e Inversiones Limitada, MetLife Investment Management Japan, Ltd., MIM I LLC, MetLife Investment Management Europe Limited and Affirmative Investment Management Partners Limited.

 The persistent deficit has pushed gross U.S. debt- to-GDP to over 110%, far above the median 49% of other countries Fitch rates as AA.2 Recently higher rates have also pushed up the cost of debt rollover and interest payments, and the U.S.’ interest-to- revenue ratio of over 13% is more akin to a BBB- rated sovereign rather than a high-rated developed market economy. Moreover, unavoidable cost pressures from nondiscretionary outlays such as Social Security, Medicare, and Medicaid from cost- of-living price adjustments and an increase in the number of retirees mean that the debt trajectory will increase in virtually all plausible scenarios. Interest payments would increase further as the Fed rolls off Treasuries from its balance sheet.3
 Some of this reflects the global trend of holding fewer Treasury reserves as noted above. However, some part also appears to be official reserves rebalancing away from U.S. Treasuries. Official holdings have fallen in recent years—particularly after the Russian invasion of Ukraine and the subsequent sanctions placed on Russia, as countries responded to sanctions risks. There have been some countervailing shifts in private holdings which partly offset those decreases.


