Economic Overview
The first half of 2023 was a whipsaw of economic and real estate data that turned from gloomy to bright and back again, seemingly by the day. As the fog lifts from this noisy backdrop, we believe the case for a soft landing has become more pronounced.
The most notable change over the past few months has been meaningful progress on inflation.
As of the most recent reading, headline CPI registered a 3.7% year-over-year increase, markedly different from the 8.9% peak from last year.1 Inflation measures excluding shelter components have declined even more. The shelter component has a well-documented lag, and observing real-time data from MIM’s portfolio of roughly 25,000 managed residential rental units across the U.S. gives us conviction that the shelter component will decline toward the Fed’s 2% target through the remainder of the year (exhibit 1).

Consumers and businesses are also showing more signs of optimism due to moderating inflation and a resilient labor market. The Conference Board’s consumer confidence index registered a healthy 103 in September; down slightly from an 18-month high in July.2 Additionally, the second quarter GDP report showed an acceleration in business investment, an indication that businesses feel better about the near-term future.3
However, not all data over the past several months have been positive. Though the likelihood of a soft landing has increased, we continue to expect a mild recession to occur in the next 12 months due to several risks to the Outlook.
On August 1, Fitch downgraded the U.S. federal government’s AAA credit rating to AA+, the second such downgrade since S&P’s similar move in 2011. Fitch cited concerns over fiscal governance and rising deficits in its rating decision. Importantly — and as we have outlined in a number of previous reports — Fitch highlighted the nation’s rising interest-service burden, and the challenges the U.S. will have without implementation of timely corrective measures. We wonder if there will be incentives among policy makers to keep inflation higher than usual to inflate away excessive debt levels, similar to what occurred in the 1970s. Given that real estate income growth is tied to inflation, we think real estate could be a hedge against a number of increasingly probable monetary policy paths that include elevated inflation.
Additionally, we believe the resumption of student loan payments will act as an economic headwind, which could weigh on consumer spending and thus, real estate demand in early 2024. Increasing credit card usage and receding checking account balances are also early warning signs of weakening consumer health.
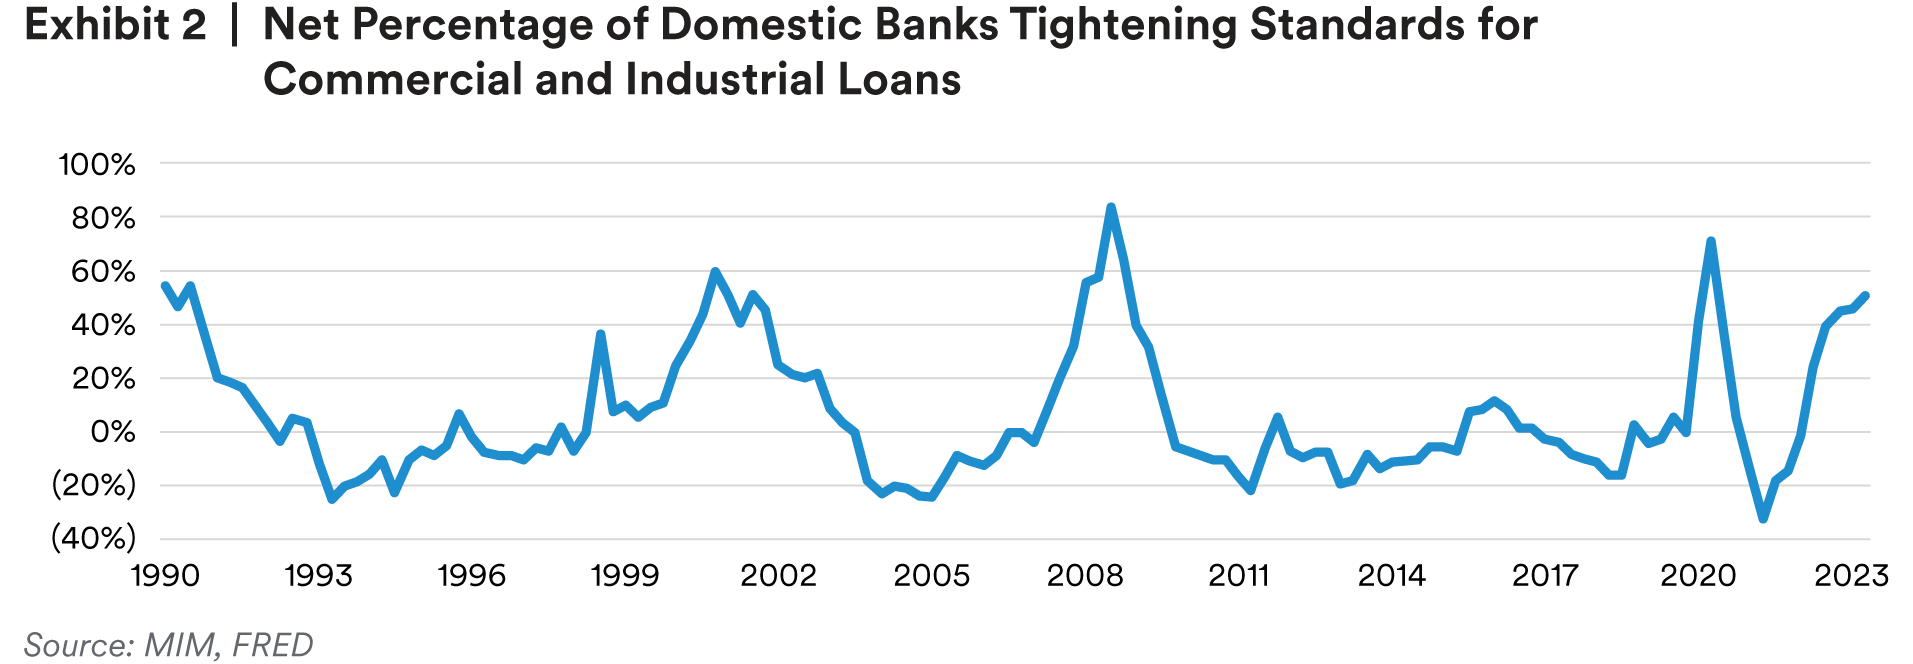
Lastly, credit conditions were tightened further as the Federal Reserve kept pressure on the inflation fight by hiking rates an additional 25 basis points (bps) in July. Credit conditions across the economy are near the highest level on record (exhibit 2) and will likely be a drag on growth in the near term.

Similar to our economic outlook, real estate capital market conditions remain challenged, but are beginning to show some bright spots.
Capital Market Conditions
The most important update in real estate capital market conditions over the past few months is early signals that transaction activity is thawing.
In our view, the wide bid-ask spread that has driven transaction volume back to COVID-19-era lows is primarily a function of monetary policy uncertainty. Underwriting can be a challenge when market participants do not agree on the future path of interest rates and therefore — discount rates/required returns. Exhibit 3 shows that monetary policy uncertainty over the last six months has been the highest on record.4 However, recent month-to-month data show that monetary policy uncertainty might be peaking. MIM believes that the Fed has completed its rate hike cycle, and that the 10-year Treasury will end 2023 in the low 4% range before declining to 3.5% at the end of 2024, as the economy cools.

We expect transaction volume to continue improving during the remainder of 2023 and expect the number of institutional-quality trades to reach normal levels by the second half of 2024, as uncertainty about rates subsides.
Even the illiquid office sector is beginning to see capital markets improvement, in our view, with buyers and sellers tightening the bid-ask spread and the number of trades modestly growing. This is further evidenced by the amount of time office assets for sale are sitting on the market, which peaked at 15 months in late 2021, and has declined to around 13 months today (exhibit 4).5

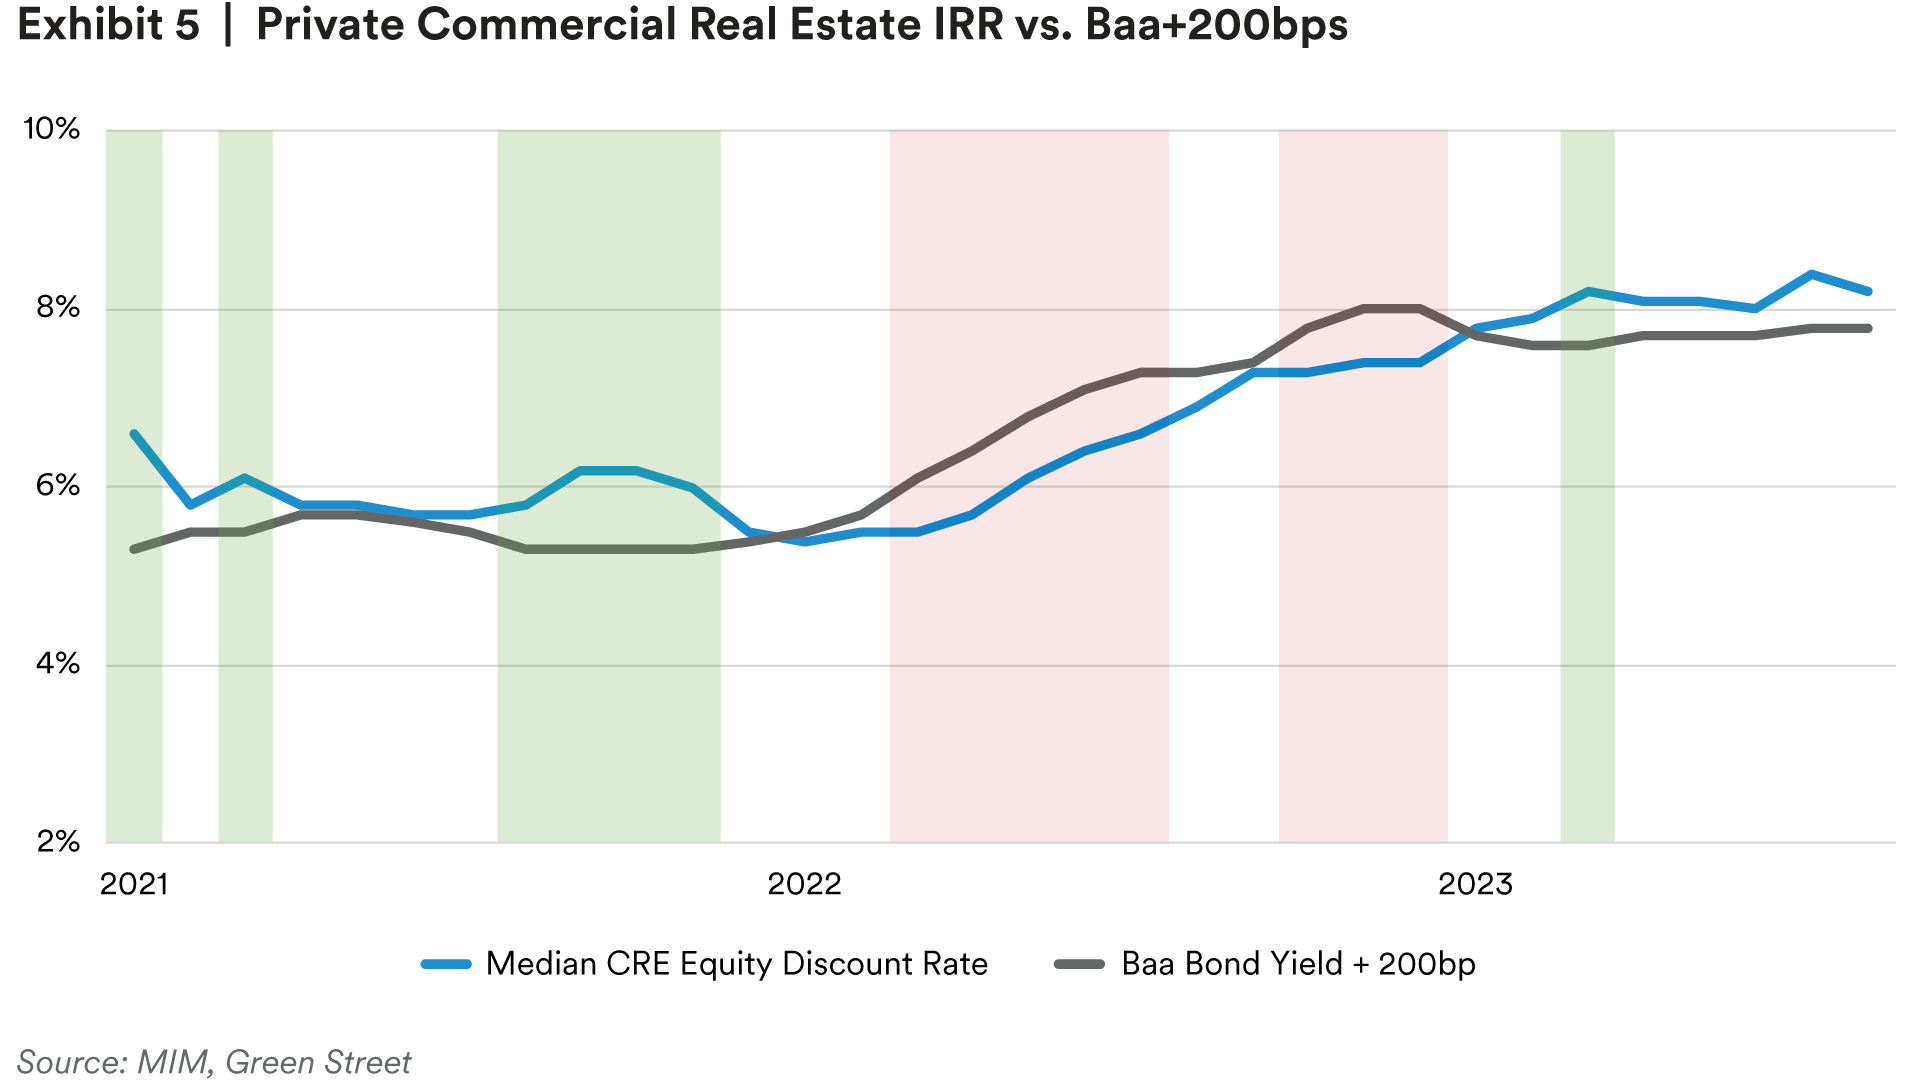
Lastly, our closely tracked metric comparing equity yields to Baa corporate bond yields +200 bps that we have reviewed in several prior reports is indicating that real estate equity is offering fair-to-attractive relative value in the spot market (exhibit 5). This, along with recovering public markets that have helped heal the denominator effect on commercial real estate, should continue to draw investor capital into the sector in our view.

Filling Up the Capital Stack
Spreads for higher-yielding debt and preferred equity have been widening this year. In normal conditions, the difference between senior mortgages and these higher-yielding segments of the capital stack might be 200-300 bps. That spread has widened, with certain higher-yielding segments pricing closer to 400 bps this year, and we believe there are three reasons why. These include [1] declining property values, making refinancing senior mortgages with traditional sources and at traditional loan-to-value (LTV) levels more challenging; [2] stress in the banking sector; [3] continued weak fundamentals in the office sector, which are having a contagion effect across all commercial real estate.
Traditionally, institutional-quality commercial mortgages follow an interest-only or partial-amortization schedule where a portion of the principal may be paid down during the life of the loan, followed by a balloon payment at maturity that is normally funded through a sale or refinance. In normal market conditions when values are growing during the life of a loan, we see refinancing with lenders like banks or insurance companies is uneventful, and borrowers expect to have little trouble sourcing a new 60 or 65% LTV loan at maturity.
Today, however, properties that were worth $100mm at the time of loan origination may only be worth $80mm. Now, a borrower who must refinance a $65mm loan is faced with a challenge. We think few senior mortgage lenders are willing to lend up to 80% LTV ($65/$80), so the borrower may source a senior loan for $50mm, and either put more money into the investment or search elsewhere for the remaining $15mm. The extent to which this is occurring is part of the reason we believe the opportunity for higher-yielding debt and preferred equity investing has grown.
The second reason why opportunities exist in this space today is stress in the banking sector. Banks are a significant source of commercial real estate loans, representing 39% of outstanding loans.6 The combination of real estate market turmoil and interest rate-related banking stress has caused regulators and bank executives to increase capital reserves, effectively sidelining banks for the foreseeable future. Banks are a particularly important source of construction financing, in addition to financing traditional mortgages.
Lastly, we see many lenders are reluctant to increase exposure to stressed real estate segments, like the office sector, retail and some more complex property types like hotels. As a result, these property types are likely facing a liquidity gap, pushing up yields even for senior first-lien mortgages.
Most property types are facing challenges on the capital markets front, but with the exception of the office sector, supply and demand fundamentals, in our view, look more sanguine.
Apartment Outlook
After softening late last year, residential rents are growing again, due in part to a still-tight for-sale housing market, continued wage growth and stable labor market conditions.
Apartment asking rents grew 1.1% in the second quarter of 2023, an acceleration versus the prior two quarters of negative rent growth.7 We expect modestly positive rent growth through the remainder of the year, even as vacancies increase toward their historical average. “Sunbelt markets” have been generally underperforming due to high-supply pipelines and a tightening relationship between rents and incomes. Palm Beach, Orlando, Phoenix and Austin posted the worst rent growth of the top 50 U.S. markets during the second quarter of 2023. Boston, Washington DC and Chicago were among the markets with the highest quarterly rent growth, all around 2%.8

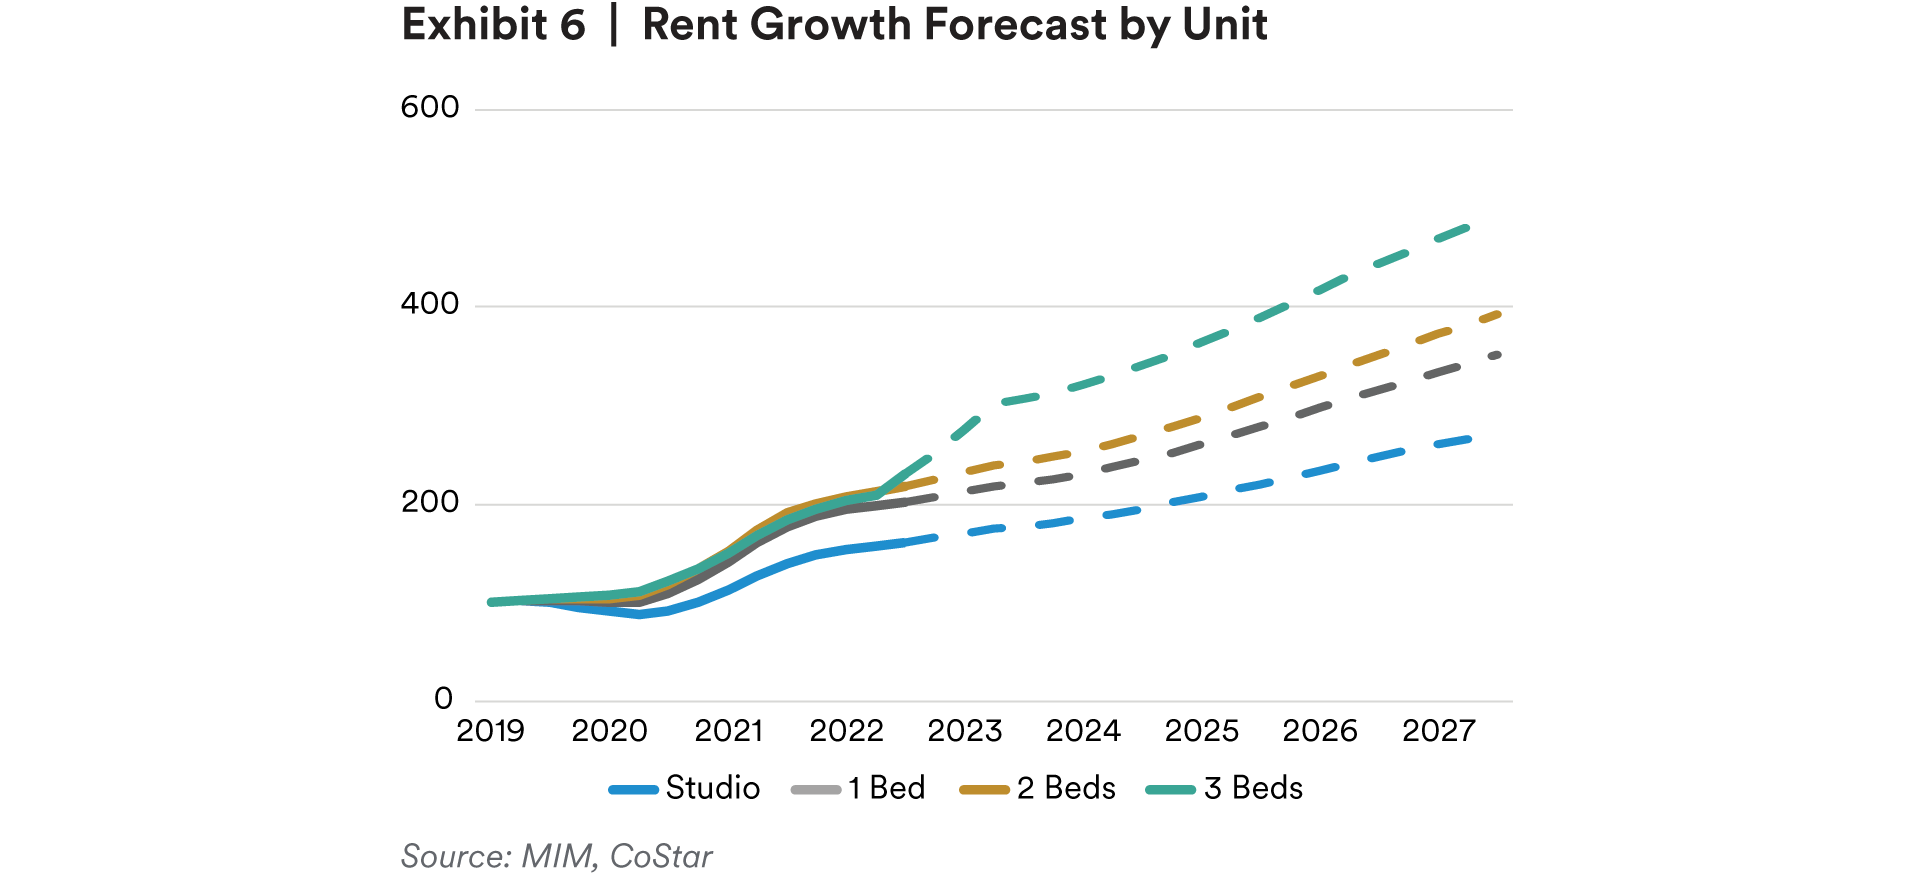
We continue to tilt towards larger-format rentals, including single-family rentals, manufactured housing and apartments with a greater concentration of 2- and 3-bedroom units. These unit types have been outperforming studio and 1-bedroom formats, and we believe this could continue due to demographic shifts that will likely be occurring through the end of the decade (aging Millennials), as well as gradually shifting space preferences to accommodate hybrid work-from-home arrangements (exhibit 6).
Office Outlook
The office sector posted another period of negative net-leased space despite positive office-using employment growth last quarter; although, as has been the case for the past two years, lower-quality assets accounted for the bulk of weakening demand. National office data show A+ assets experienced positive net leasing for the 10th consecutive quarter in 2Q 2023.9
Thus far, we believe remote working has accounted for a roughly 7% structural decline in office demand (exhibit 7).a We expect the structural decline to continue rising from 7% as companies continue to make space-use decisions, and leases continue to expire, to around 9% next year.
Our base-case expectation is that remote work and moderating office-using employment growth will continue to drag on leasing into 2024, and the office vacancy rate will rise from 18.2%10 today to 19% or 20% by the end of next year. Spot market values for the office sector have still likely not found a trough, and any new office investments, even high-quality assets with long average-lease terms, are generally commanding value-add or opportunistic returns.
While we don’t have a crystal ball and acknowledge space-use decisions are happening in real time, we think the market is approaching peak negativity for the office outlook, and investors are not acknowledging or pricing in the possibility that the remote-work impact stabilizes or even improves going forward.

A number of Fortune 500 firms have made forceful return-to-work announcements over the past several months, even including tech firms that implemented the most liberal work-from-anywhere policies during the pandemic.
We think investors should consider the possibility that weak office leasing is now more a function of the uncertain economic outlook than it is downsizing due to remote working.
If that were the case, in an upside scenario for office, we would expect net office leasing to turn positive in late-2024, as the economy recovers from a soft landing or a potential mild and short-lived recession and then enters an expansion phase. In this scenario, we believe office leasing could return to pre-COVID-19 velocity by 2025. We think there is around a 15% chance of this upside outcome.
Retail Outlook
High-profile retail bankruptcies have made headlines in 2023, but halfway through the year, store openings are handily outpacing store closings, like the trend observed in 2022. We attribute this to a combination of healthy consumer spending and an increase in demand for discounters and off-price stores that are e-commerce resilient (exhibit 8).

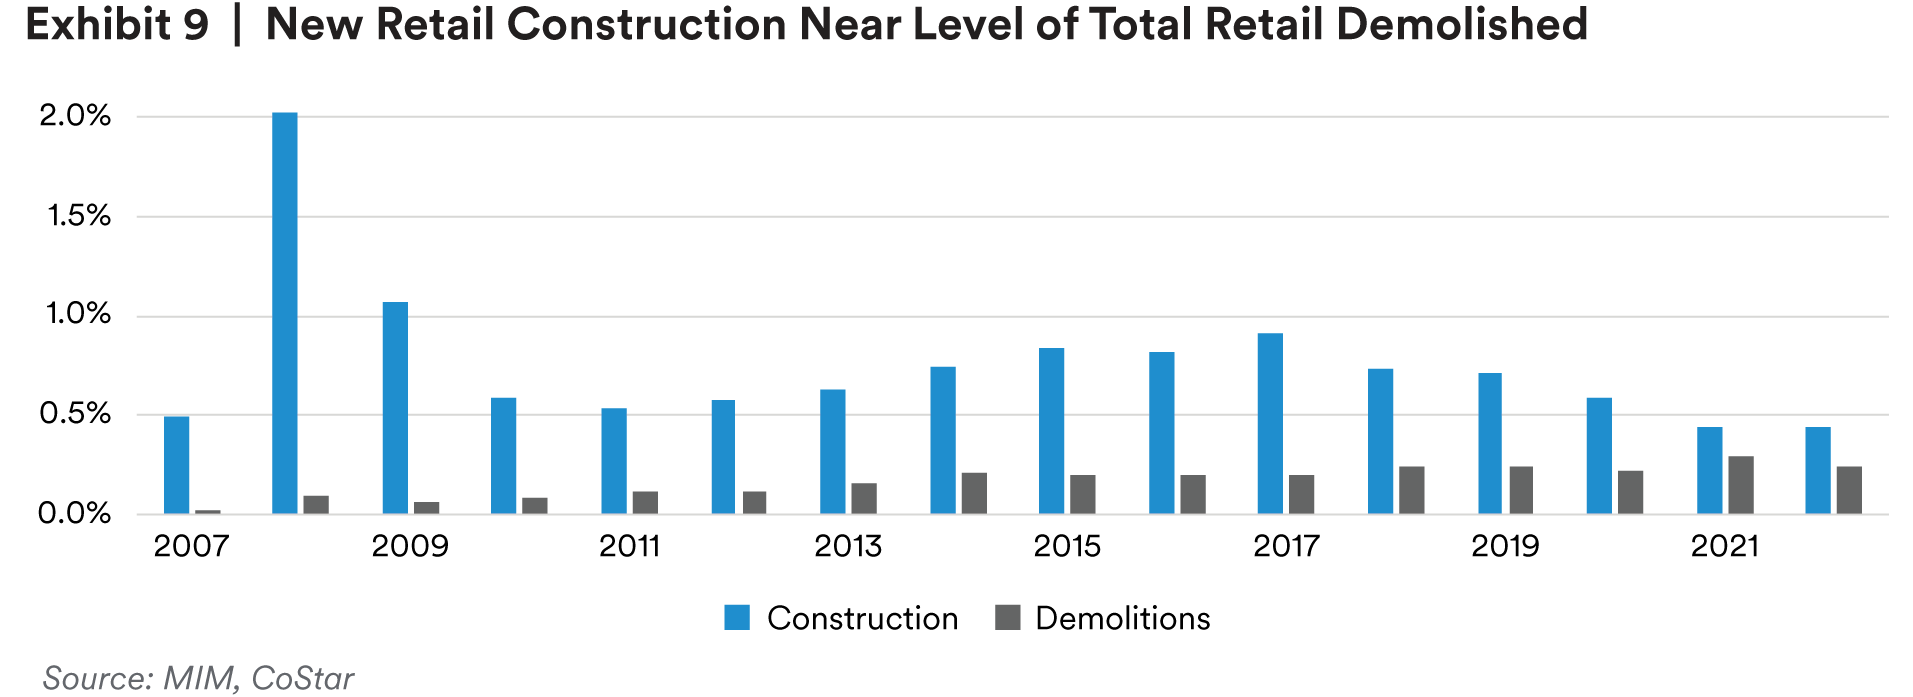
Due in part to store openings exceeding closings, retail vacancy rates are now near a 20-year low11, which is beginning to generate healthy rent growth for the sector. Positive demand conditions are not the entire story, however. A declining supply pipeline and an accelerating rate of demolitions have also helped bring fundamentals into balance (exhibit 9). We believe these favorable supply conditions should help retail vacancies to remain below their historical average, even as consumption and the broader economy moderate into 2024.

Within retail segments, we continue to favor centers with low operating expense ratios, and experience-based tenants and elements, which add e-commerce resiliency.
Industrial Outlook
After a two-year streak of robust fundamentals, the sector continues to show signs of moderating. Industrial vacancies increased 40 bps in the second quarter of 2023, the fourth consecutive quarter of increases.12 Industrial is being impacted by a simultaneous moderation in demand back to normal levels, and a large supply pipeline that continues to deliver space to the market.
The vacancy rate is now 4.7%, above the recent all-time low of 3.8%, but still well below the long-term historical average of 7.2%.13 Despite rising vacancies, we believe the tight market should continue to generate healthy rent growth in the near term. We expect 5.2% average rent growth in 2023 and 4.2% rent growth in 2024.
While supply growth has been a challenge, fallout from inflation, higher interest rates and the regional banking crisis are pushing up construction costs and causing supply growth to moderate.
As shown in exhibit 10, industrial construction starts have rapidly declined since the middle of 2022. In our view, this should translate to reduced deliveries in mid-2024, given the average development timeline for industrial of roughly 12-18 months.

Across markets, cities that have favorable demographic conditions, port cities in the sunbelt and on the east coast, and cities that have low-cost labor pools and/or manufacturing infrastructure are outperforming the broader U.S. markets. Examples include Miami, Orlando, Northern NJ, Richmond, Nashville, Milwaukee, Phoenix, Memphis, Savannah and Tampa. We expect these markets to remain rent-growth outperformers into 2024.
Tracking Alternatives
Outside the core property types, MIM tracks a number of institutional-quality alternative property types. In order to evaluate the opportunity set, we survey MIM’s regional acquisitions teams to assess current spot market yields for stabilized properties. We then apply risk adjustments based on current supply/demand conditions, historical performance volatility, operating expense loads and average CapEx needs to produce estimated risk-adjusted returns for all core and alternative property type classes. Finally, we bucket property types into overweight/underweight categories based on rankings of risk-adjusted returns.
This analysis suggests that the most favorable opportunities exist in infill industrial, limited-service hotels and residential alternatives (seniors housing, manufactured housing and moderate income housing). Cold storage, single-tenant net-lease retail and active adult/55+ housing also score favorably. Importantly, this analysis is an unconstrained view that does not consider factors like portfolio diversification or MSA exposures (i.e., Life Science may only be available in several markets), and does not reflect higher-yielding strategies like ground-up development.

Conclusion
2023 has provided a torrent of economic and financial markets news, flipping between positive and negative indicators on a seemingly daily basis. Despite the noise, little has changed in our fundamental macro view. Labor market conditions are stable, but we remain vigilant about the impacts inflation and hawkish monetary policy could have on consumers, and thus real estate demand, in the next 12 months.
Despite the risks, the real estate market is presenting opportunities for well-capitalized investors, as is the case in most prior challenging markets in our view. In the office sector, negativity around the outlook maybe be peaking, which could mean spot-market prices are near a trough. In the residential sector, we see larger-format rentals continue to outperform. Retail and industrial are experiencing healthy fundamentals at the same time, which has not happened in over a decade. Real estate capital markets remain challenged, but we believe unlevered equity assets are offering favorable relative value. Debt markets remain dislocated as a result of a pullback from banks, which is creating strong opportunities for senior mortgage, mezzanine, and preferred equity investors, in our view.
Endnotes
1 BLS. September 2023.
2 Conference Board. September 2023.
3 BEA. September 2023.
4 Economic Policy Uncertainty Index. Northwestern University, Stanford University, University of Chicago. September 2023.
5 CoStar. September 2023.
6 Federal Reserve, Flow of Funds report. September 2023.
7 CoStar. September 2023.
8 Ibid.
9 Ibid.
10 CBRE-EA. September 2023.
11 Ibid.
12 Ibid.
13 Ibid
a Calculation based on a linear regression between office vacancy, office using employment growth and net office inventory growth. Remote work impact on office demand represents the difference between modeled and observed vacancy post-COVID-19.
Disclaimer
This material is intended solely for Institutional Investors, Qualified Investors and Professional Investors. This analysis is not intended for distribution with Retail Investors.
This document has been prepared by MetLife Investment Management (“MIM”)1 solely for informational purposes and does not constitute a recommendation regarding any investments or the provision of any investment advice, or constitute or form part of any advertisement of, offer for sale or subscription of, solicitation or invitation of any offer or recommendation to purchase or subscribe for any securities or investment advisory services. The views expressed herein are solely those of MIM and do not necessarily reflect, nor are they necessarily consistent with, the views held by, or the forecasts utilized by, the entities within the MetLife enterprise that provide insurance products, annuities and employee benefit programs. The information and opinions presented or contained in this document are provided as of the date it was written. It should be understood that subsequent developments may materially affect the information contained in this document, which none of MIM, its affiliates, advisors or representatives are under an obligation to update, revise or affirm. It is not MIM’s intention to provide, and you may not rely on this document as providing, a recommendation with respect to any particular investment strategy or investment. Affiliates of MIM may perform services for, solicit business from, hold long or short positions in, or otherwise be interested in the investments (including derivatives) of any company mentioned herein. This document may contain forward-looking statements, as well as predictions, projections and forecasts of the economy or economic trends of the markets, which are not necessarily indicative of the future. Any or all forward-looking statements, as well as those included in any other material discussed at the presentation, may turn out to be wrong.
All investments involve risks including the potential for loss of principle and past performance does not guarantee similar future results. Property is a specialist sector that may be less liquid and produce more volatile performance than an investment in other investment sectors. The value of capital and income will fluctuate as property values and rental income rise and fall. The valuation of property is generally a matter of the valuers’ opinion rather than fact. The amount raised when a property is sold may be less than the valuation. Furthermore, certain investments in mortgages, real estate or non-publicly traded securities and private debt instruments have a limited number of potential purchasers and sellers. This factor may have the effect of limiting the availability of these investments for purchase and may also limit the ability to sell such investments at their fair market value in response to changes in the economy or the financial markets.
In the U.S. this document is communicated by MetLife Investment Management, LLC (MIM, LLC), a U.S. Securities Exchange Commission registered investment adviser. MIM, LLC is a subsidiary of MetLife, Inc. and part of MetLife Investment Management. Registration with the SEC does not imply a certain level of skill or that the SEC has endorsed the investment advisor.
This document is being distributed by MetLife Investment Management Limited (“MIML”), authorised and regulated by the UK Financial Conduct Authority (FCA reference number 623761), registered address 1 Angel Lane, 8th Floor, London, EC4R 3AB, United Kingdom. This document is approved by MIML as a financial promotion for distribution in the UK. This document is only intended for, and may only be distributed to, investors in the UK and EEA who qualify as a “professional client” as defined under the Markets in Financial Instruments Directive (2014/65/EU), as implemented in the relevant EEA jurisdiction, and the retained EU law version of the same in the UK.
For investors in the Middle East: This document is directed at and intended for institutional investors (as such term is defined in the various jurisdictions) only. The recipient of this document acknowledges that (1) no regulator or governmental authority in the Gulf Cooperation Council (“GCC”) or the Middle East has reviewed or approved this document or the substance contained within it, (2) this document is not for general circulation in the GCC or the Middle East and is provided on a confidential basis to the addressee only, (3) MetLife Investment Management is not licensed or regulated by any regulatory or governmental authority in the Middle East or the GCC, and (4) this document does not constitute or form part of any investment advice or solicitation of investment products in the GCC or Middle East or in any jurisdiction in which the provision of investment advice or any solicitation would be unlawful under the securities laws of such jurisdiction (and this document is therefore not construed as such).
For investors in Japan: This document is being distributed by MetLife Asset Management Corp. (Japan) (“MAM”), 1-3 Kioicho, Chiyoda[1]ku, Tokyo 102-0094, Tokyo Garden Terrace KioiCho Kioi Tower 25F, a registered Financial Instruments Business Operator (“FIBO”) under the registration entry Director General of the Kanto Local Finance Bureau (FIBO) No. 2414.
For Investors in Hong Kong S.A.R.: This document is being issued by MetLife Investments Asia Limited (“MIAL”), a part of MIM, and it has not been reviewed by the Securities and Futures Commission of Hong Kong (“SFC”). MIAL is licensed by the Securities and Futures Commission for Type 1 (dealing in securities), Type 4 (advising on securities) and Type 9 (asset management) regulated activities.
For investors in Australia: This information is distributed by MIM LLC and is intended for “wholesale clients” as defined in section 761G of the Corporations Act 2001 (Cth) (the Act). MIM LLC exempt from the requirement to hold an Australian financial services license under the Act in respect of the financial services it provides to Australian clients. MIM LLC is regulated by the SEC under US law, which is different from Australian law.
MIMEL: For investors in the EEA, this document is being distributed by MetLife Investment Management Europe Limited (“MIMEL”), authorised and regulated by the Central Bank of Ireland (registered number: C451684), registered address 20 on Hatch, Lower Hatch Street, Dublin 2, Ireland. This document is approved by MIMEL as marketing communications for the purposes of the EU Directive 2014/65/EU on markets in financial instruments (“MiFID II”). Where MIMEL does not have an applicable cross-border licence, this document is only intended for, and may only be distributed on request to, investors in the EEA who qualify as a “professional client” as defined under MiFID II, as implemented in the relevant EEA jurisdiction. The investment strategies described herein are directly managed by delegate investment manager affiliates of MIMEL. Unless otherwise stated, none of the authors of this article, interviewees or referenced individuals are directly contracted with MIMEL or are regulated in Ireland. Unless otherwise stated, any industry awards referenced herein relate to the awards of affiliates of MIMEL and not to awards of MIMEL.
1 MetLife Investment Management (“MIM”) is MetLife, Inc.’s institutional management business and the marketing name for subsidiaries of MetLife that provide investment management services to MetLife’s general account, separate accounts and/or unaffiliated/ third party investors, including: Metropolitan Life Insurance Company, MetLife Investment Management, LLC, MetLife Investment Management Limited, MetLife Investments Limited, MetLife Investments Asia Limited, MetLife Latin America Asesorias e Inversiones Limitada, MetLife Asset Management Corp. (Japan), and MIM I LLC, MetLife Investment Management Europe Limited, Affirmative Investment Management Partners Limited and Raven Capital Management LLC.


