Preserving Capital: Long IG bonds have a proven track record of preserving capital and consistently meeting obligations.
Predictable Monthly Cash Flow: Providing a reliable and predictable monthly cash flow to cover expenses and pension benefit payments.
Contributing Liquidity: Enhancing liquidity by safeguarding portfolios from forced asset sales during market stress and enabling investments in illiquid opportunities.
Capital Efficiency: Delivering a capitalefficient strategy for bond investments.
Broad Opportunity Set: Providing a diverse opportunity set, allowing for strategic allocation into credit when risk premiums widen and into U.S. Treasuries (USTs) when credit spreads are historically tight.
Returning Excess Value: Generating excess value by consistently achieving returns above market benchmarks.
In this paper, we describe the benefits to public pensions of the investment opportunity set represented by the Bloomberg U.S. Long Government/Credit1 (Long G/C) universe.
Introduction
We believe that an allocation to long duration IG bonds can provide several benefits to public pensions. In fact, they have been used by pensions for more than 15 years to achieve their risk reduction goals. Most of this demand has come from corporate pensions, driven by the accounting and minimum funding rules that apply to those plans. Although these same rules do not apply2, we believe that they deserve consideration by public pensions.
For purposes of this paper, we use the investment universe composed of the Long G/C index3 to illustrate our points. This index includes U.S. dollar denominated fixed rate USTs, government-related and corporate bonds with maturities of 10 years or more.
Preserving Capital
The Long G/C index has a long and successful track record. It was created in March of 1994. Since then, it has had an annualized return of 5.6%. The current yield on the Long G/C index is 4.91% and the average coupon is 2.74%. The Long G/C index comprises roughly 50% USTs. This percentage has varied over the lifetime of the index as illustrated below. The mix changes as corporations or the U.S. Treasury change their issuance of long bonds.

USTs have never defaulted and corporate bonds also have a very good track record with respect to defaults. From 1994 through 2023 the average annual default rate for all corporate investment grade bonds was 0.08%. In 13 of those 30 years, there were no defaults. The largest annual default rate was in 2008 during the Great Financial Crisis when 14 issuers (0.42% of 3,350 issuers) defaulted. 4

Supplying Predictable Monthly Cash Flows
The bonds in the Long G/C index provide a consistent and predictable cash flow as illustrated in

Contributing Liquidity
As mentioned earlier, the Long G/C universe is roughly half USTs and the UST market is one of the largest and most liquid markets globally. USTs also tend to appreciate during periods of market stress. There have been three recessions since the Long G/C Index was created in March 1994. During each, the Long G/C appreciated in value by 5% or more while the S&P 500 lost value.

Investment grade corporate bonds are also liquid sources of capital. One measure of liquidity is the time required to convert an asset to cash. Investment grade bonds trade on a t+1 basis meaning they are settled on the next business day after a trade. Further, USTs represent half of the Long G/C universe and have the narrowest bid/ask spreads in the bond market.
Offering Capital Efficiency
Investment grade bonds are traditionally included in asset allocations to reduce risk. They are often included based on the expectation they will appreciate during risk-off market events, i.e., flights to quality. Interest rates tend to fall during these periods of economic stress and bonds appreciate when rates fall. The longer the maturity, the greater the price appreciation.
This characteristic of bonds is measured by duration; long maturity bonds have more duration than shorter maturity bonds. As shown in Chart 4, below, the Long G/C has a duration more than twice that of the Bloomberg Aggregate (Agg) index.

In a falling rate environment, a 10% allocation to Long G/C would provide price protection like a 20% Agg allocation. This leaves more assets for return seeking investments and results in a higher expected return. This supports a higher discount rate, lower liability estimates, and higher plan funded status.

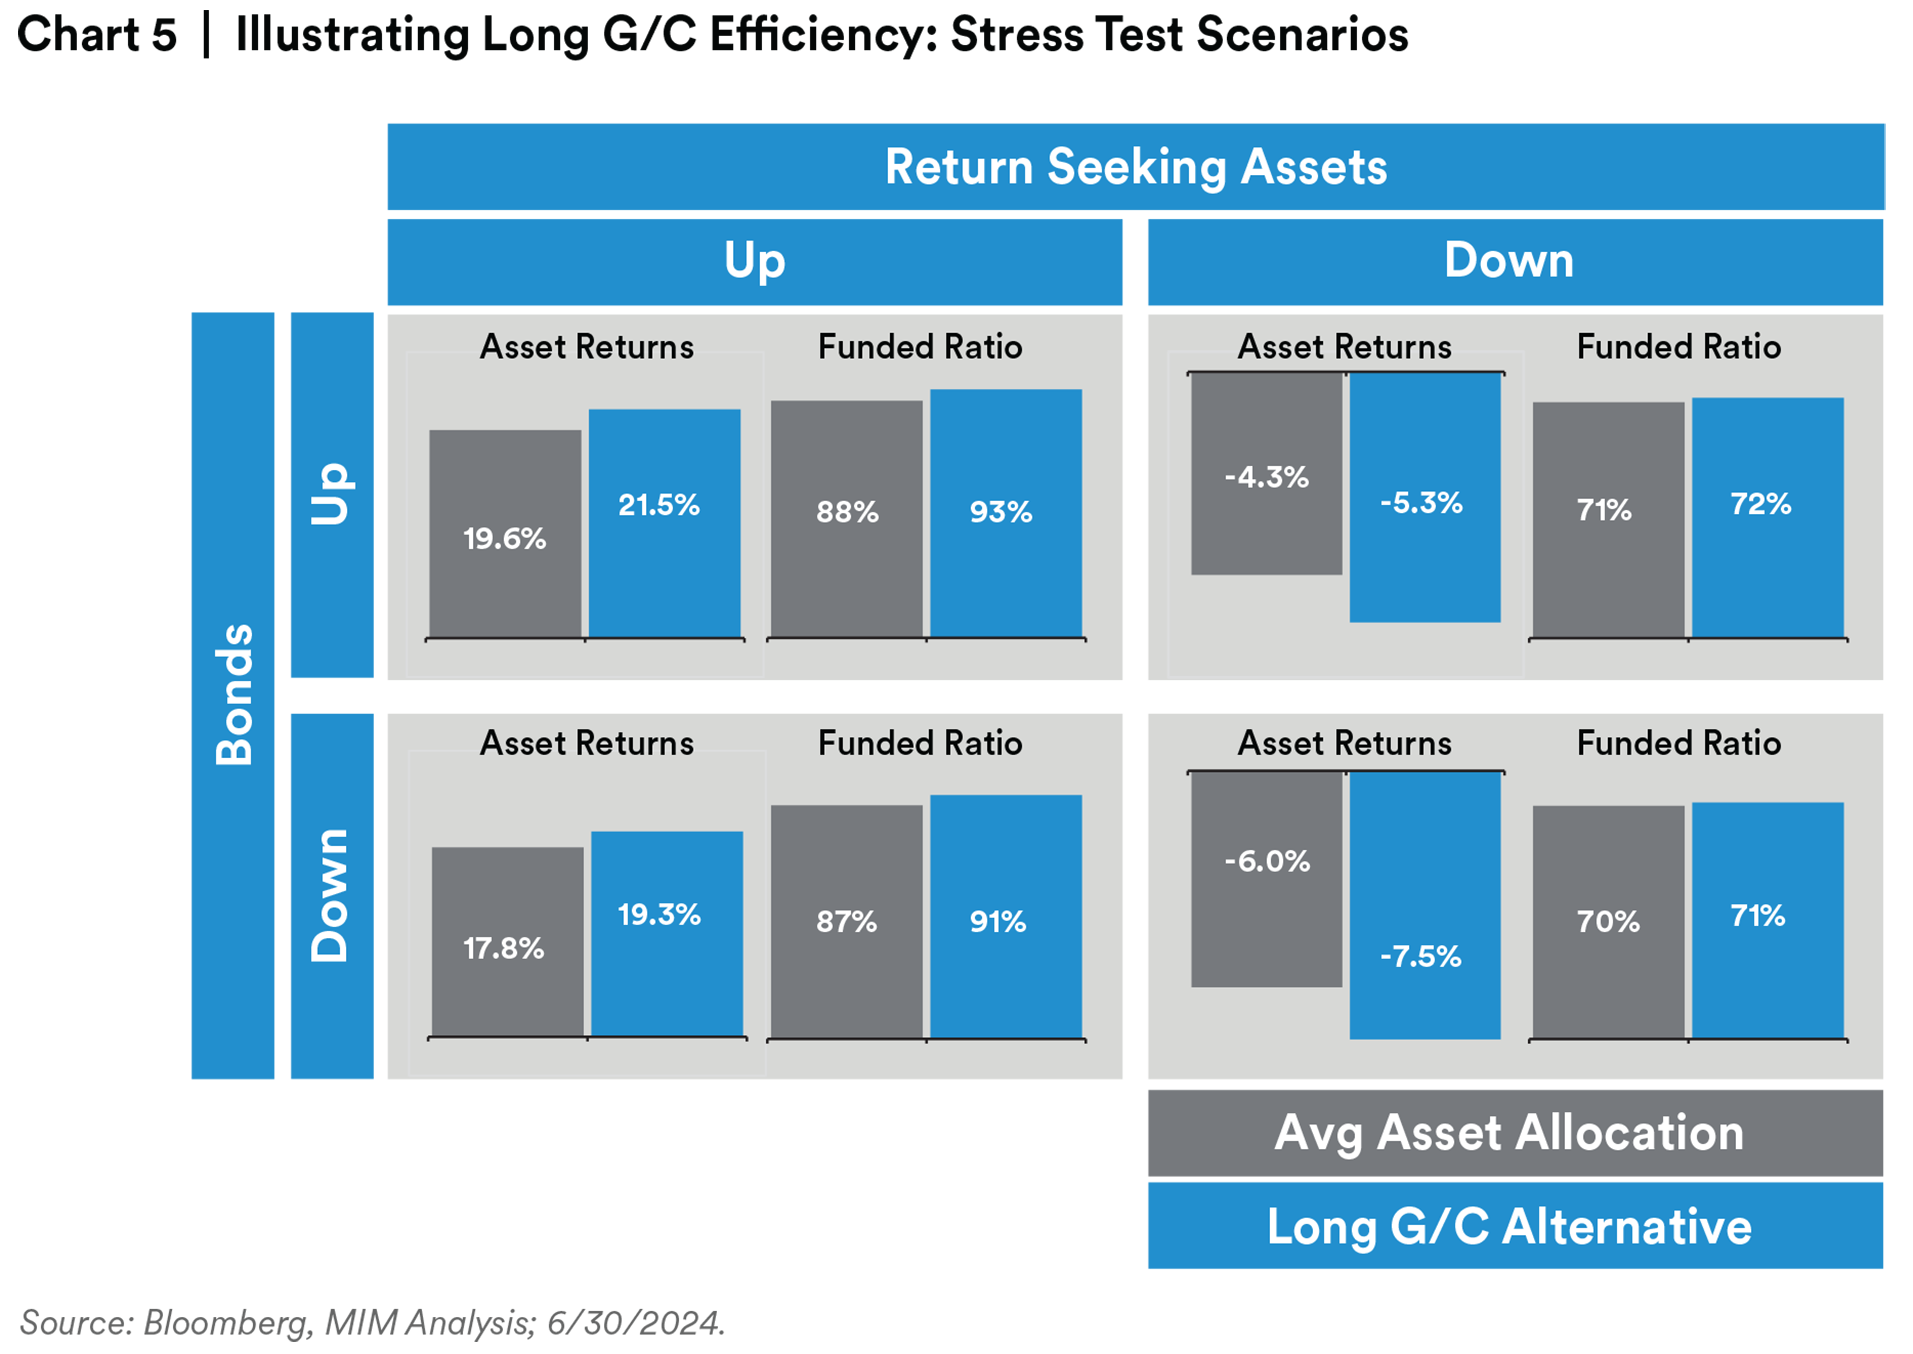
Chart 5 above compares two asset allocations: one representing the average public pension asset allocation including a bond allocation to the Bloomberg Aggregate Index and a second that substitutes the Long G/C Index. It shows results of four scenarios. These represent asset returns assuming proportional (one-standard deviation) good and bad returns. Additional details are shown in the appendix. In all scenarios, funded status is better with alternative Long G/C asset allocation.
This is mainly a consequence of the higher expected return and discount rate.
Comprising a Broad and Diverse Investment Opportunity Set
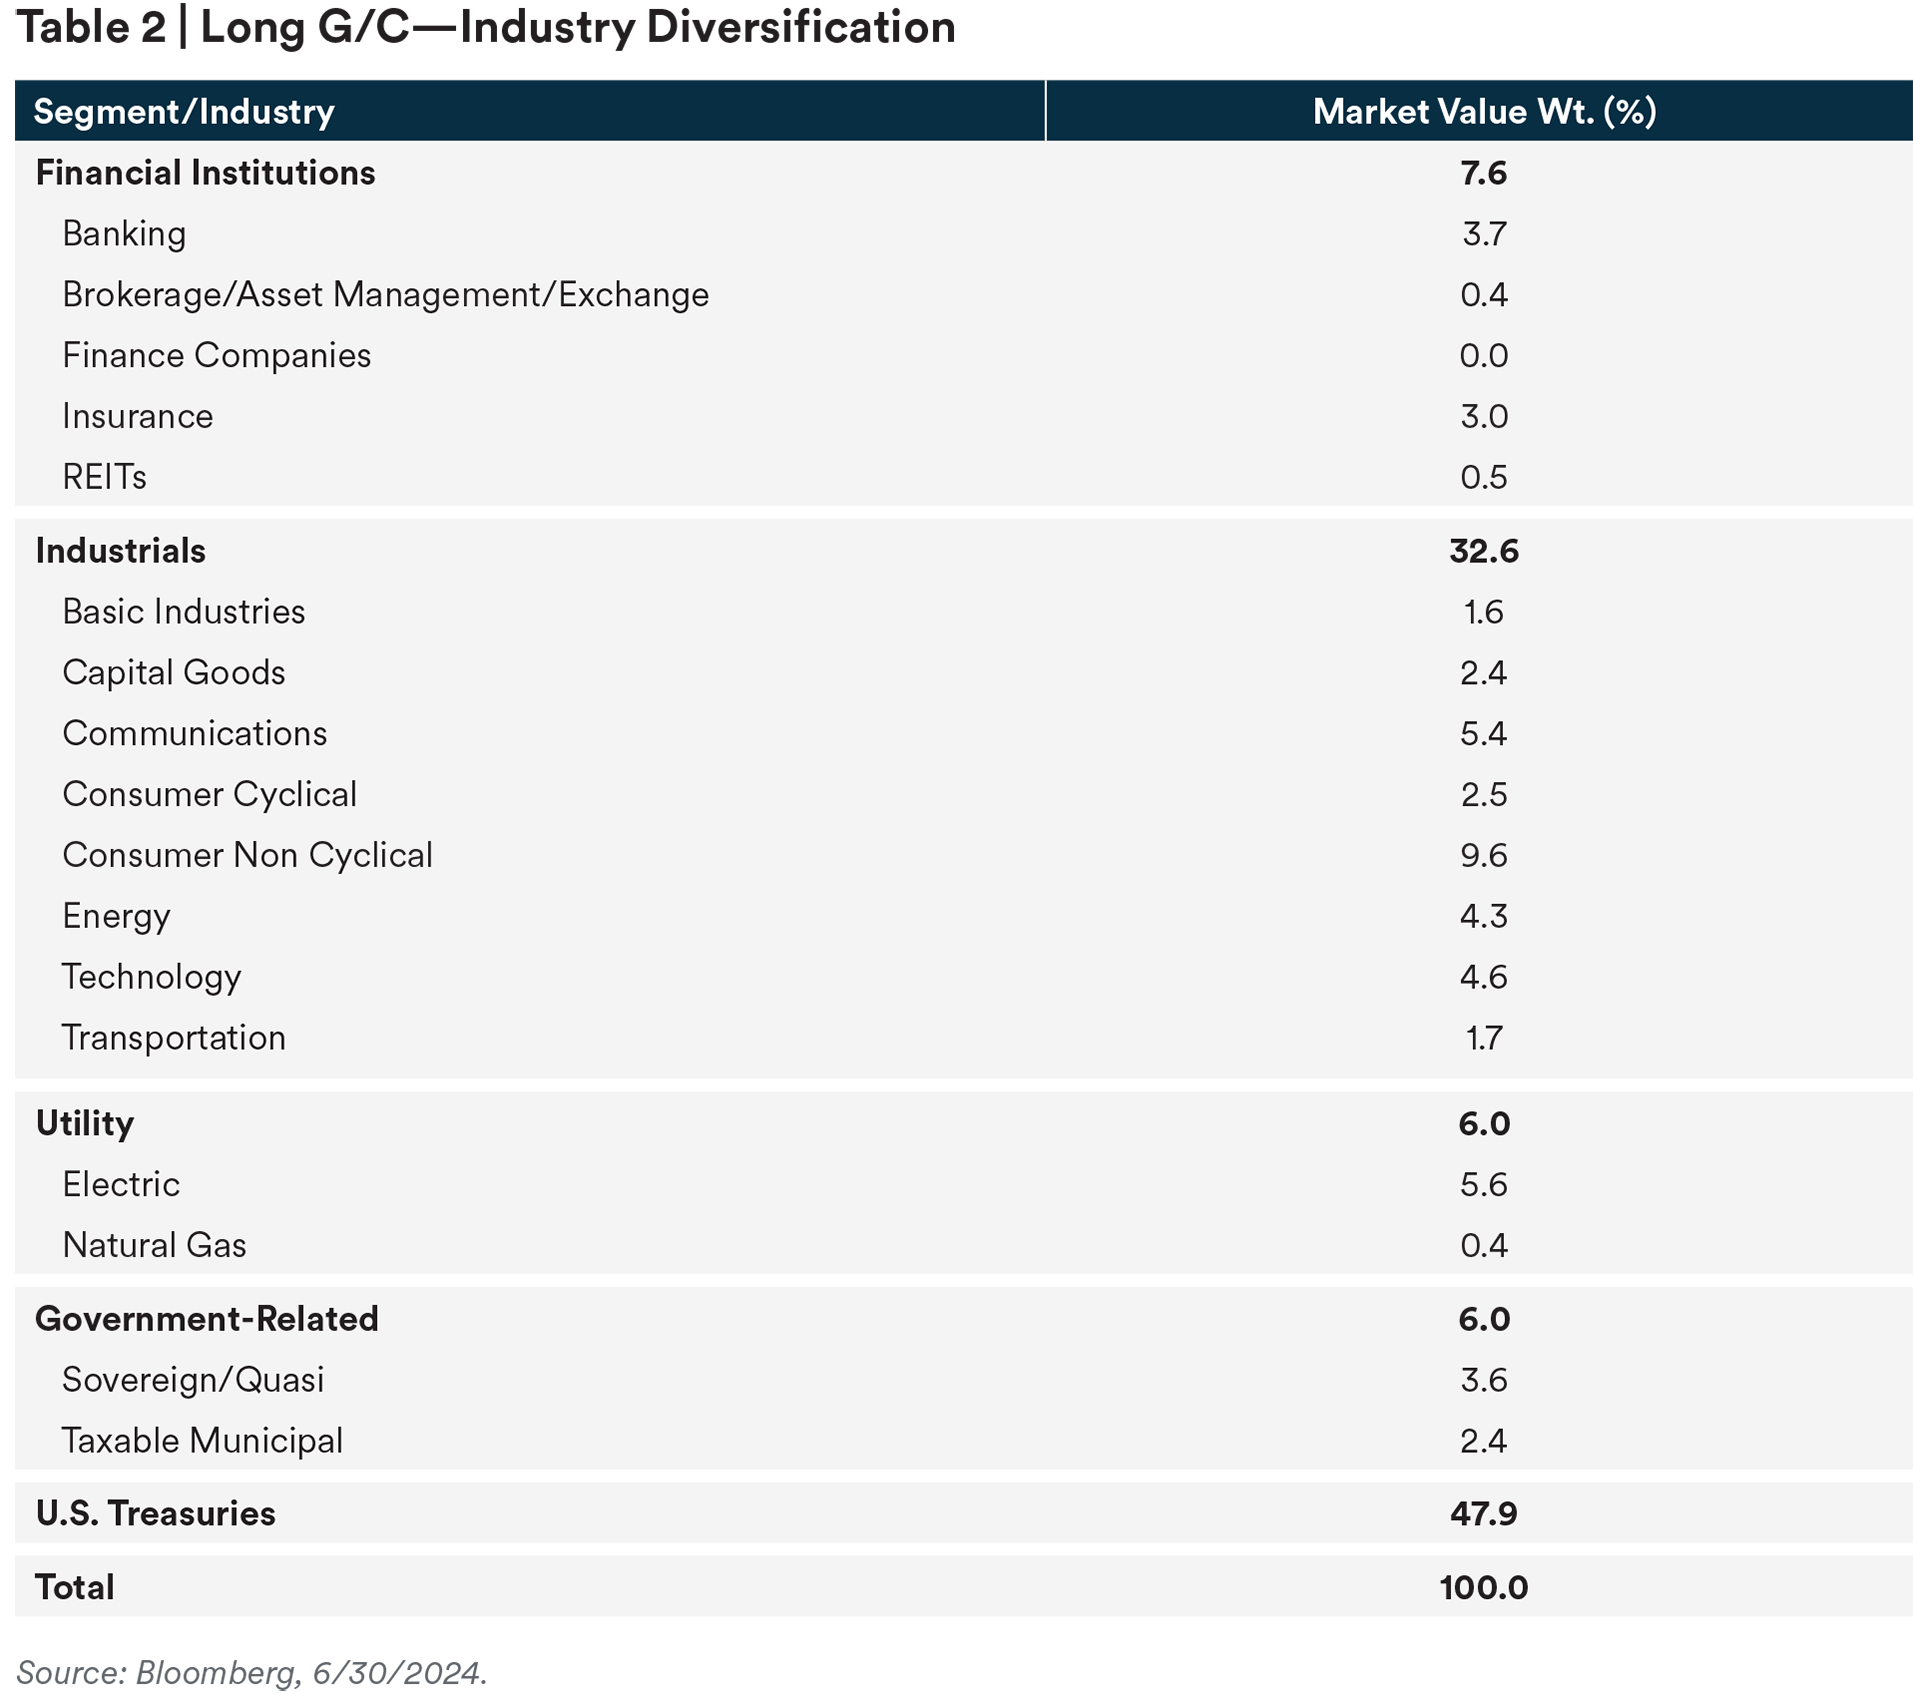
The Long G/C universe has 834 unique issuers and 3,471 unique issues. It has a market value of $4.8T. The universe comprises diverse issuers in more than 20 industries providing opportunity for diversification across issuers and against events impacting certain industries, e.g., the impact of the financial crisis on the bonds issued by banks.

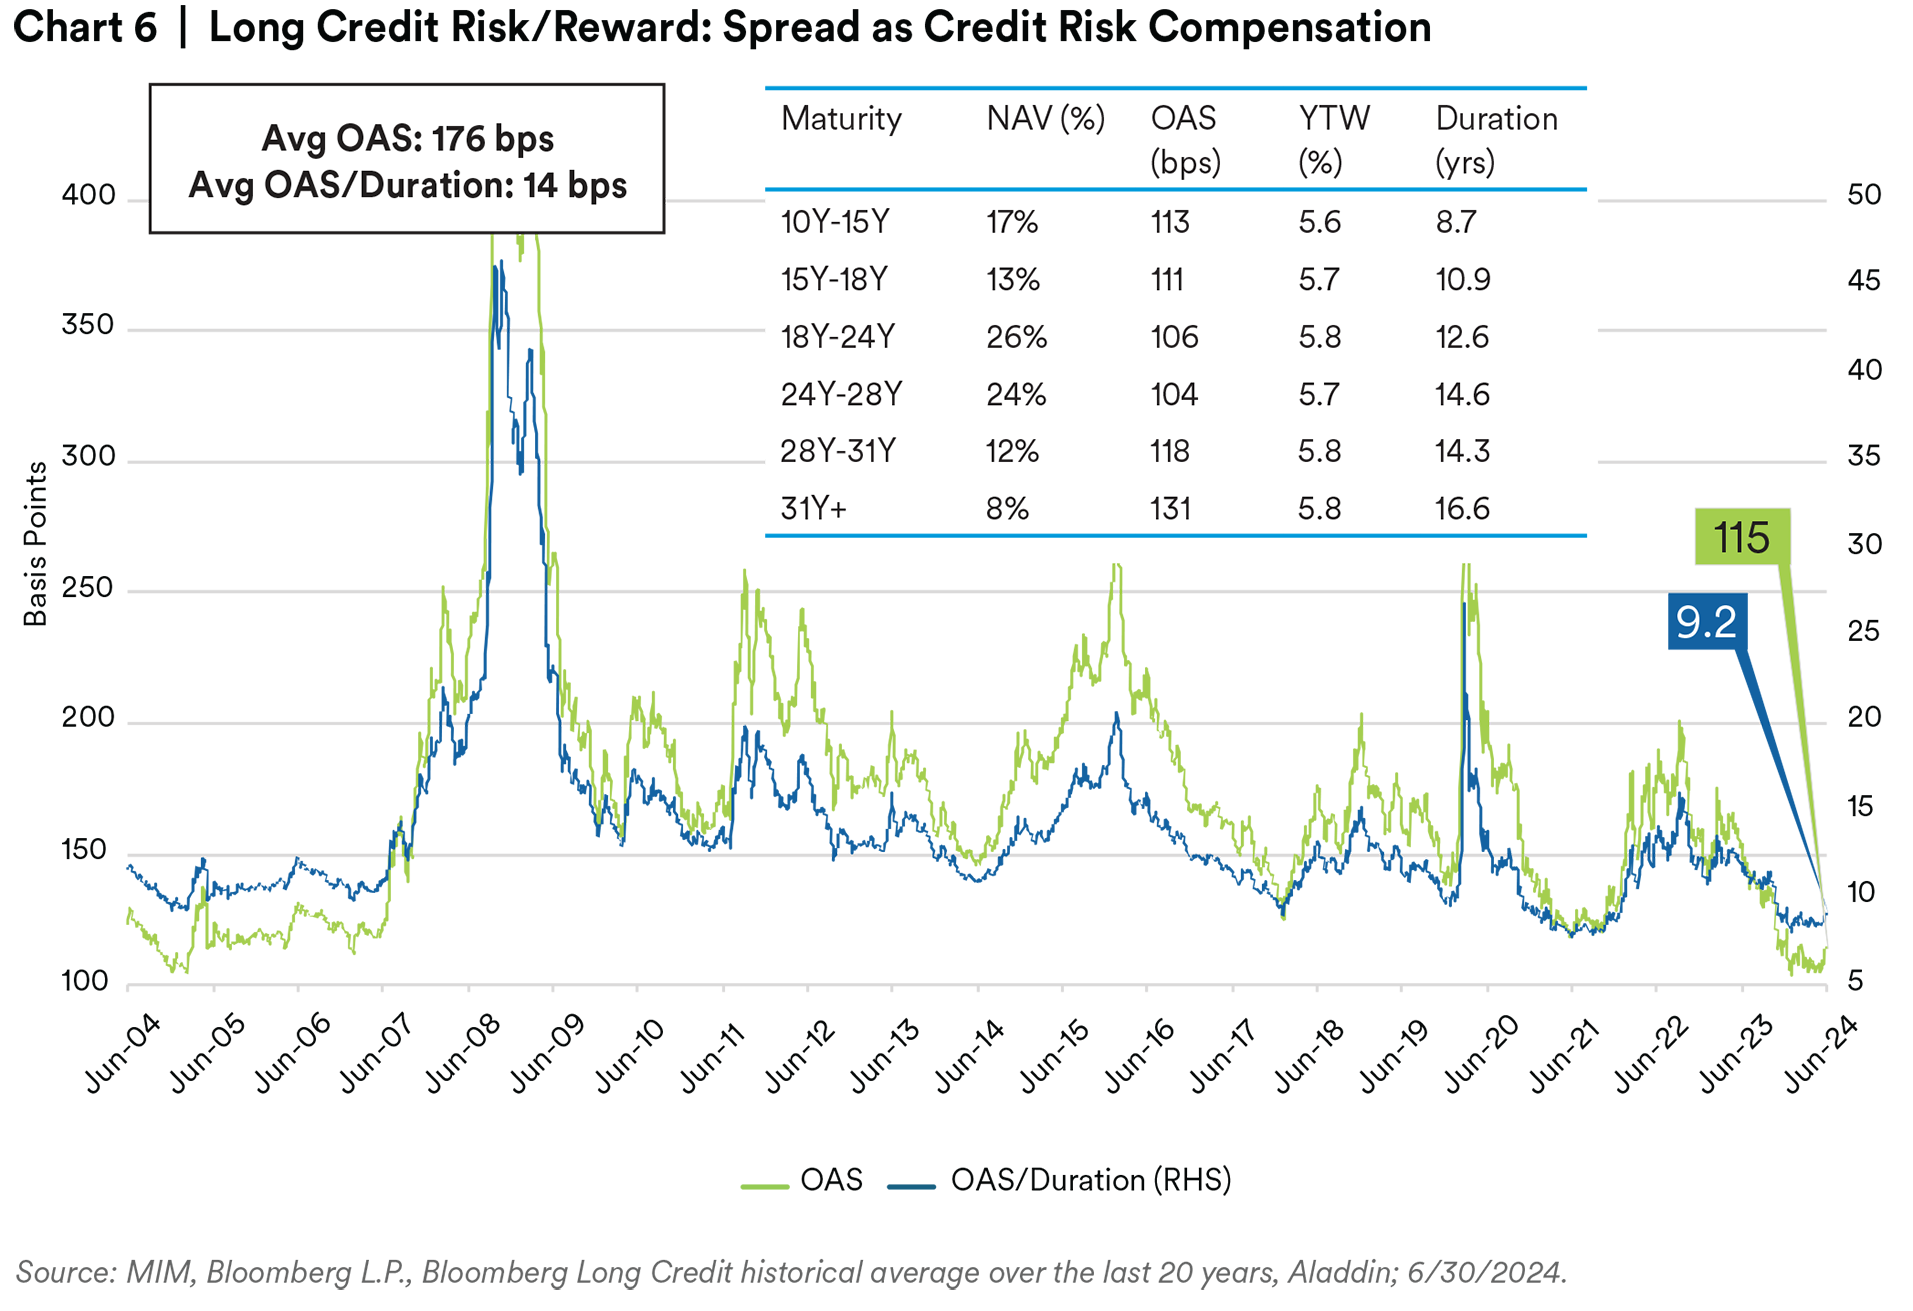
To examine the credit risk/reward in the Long G/C index, we can focus on the half of the index represented by the Long Credit index. In Chart 6 we show two measures of compensation for credit risk: Option Adjusted Spread (OAS) and OAS divided by duration. These measures are 115 and 9.2 basis points (bps) and both are below their 20-year averages of 176 and 14 bps. This indicates that currently credit risk is not well compensated. Historically, conservative positioning during these situations has resulted in excess returns. The 50/50 composition of the index facilitates investment into credit when risk/reward is favorable and away from credit when it is not appropriately compensated. We also show statistics for maturity buckets to illustrate the relative risk/reward for positioning on different parts of the curve.

Returning Excess Value
The Long G/C universe provides a broad and deep investment opportunity set to identify relative value using fundamental credit evaluation. This credit analysis provides price discovery and is a vital part of the well-functioning credit market.
Investors in these securities have differing objectives. For example, insurance companies tend to focus on yield. They complement the demand from pensions, which tend to focus on total returns. These investors have different risk-return objectives, and the benefit of this diverse demand pool can be seen in the consistent outperformance of active managers compared to the index.

Chart 7 shows the excess return and volatility for actively managed strategies in the eVestment Alliance Long G/C universe. All but one of the strategies have returns above the index and the average is 75 basis points more than the benchmark. These excess returns are typically not generated through excessive risk taking; 85% of the strategies have index-like volatility.
Active management of corporate bonds adds value to risk adjusted returns in multiple dimensions. Through diligent credit evaluation, holdings are selected not only for their potential to add value on a relative basis, but also based on change in fundamentals and credit risk. In those rare situations where a holding is downgraded below investment grade, active bond managers can also add value by seeking opportune times and prices to sell.
Conclusion
Long duration, investment grade bonds including U.S. Treasury and corporate bonds can serve a valuable risk-reduction role in public pensions. We believe they do this by preserving capital, providing reliable cash flow and liquidity, and adding diversification in a capital efficient way.
Appendix: Stress Test Details
Chart 5 above shows the result of four stress test scenarios to illustrate the capital efficiency of using Long G/C as an alternative to the Bloomberg Aggregate for the bond allocation universe. This appendix provides additional detail behind those calculations.
Assumptions and Scenarios
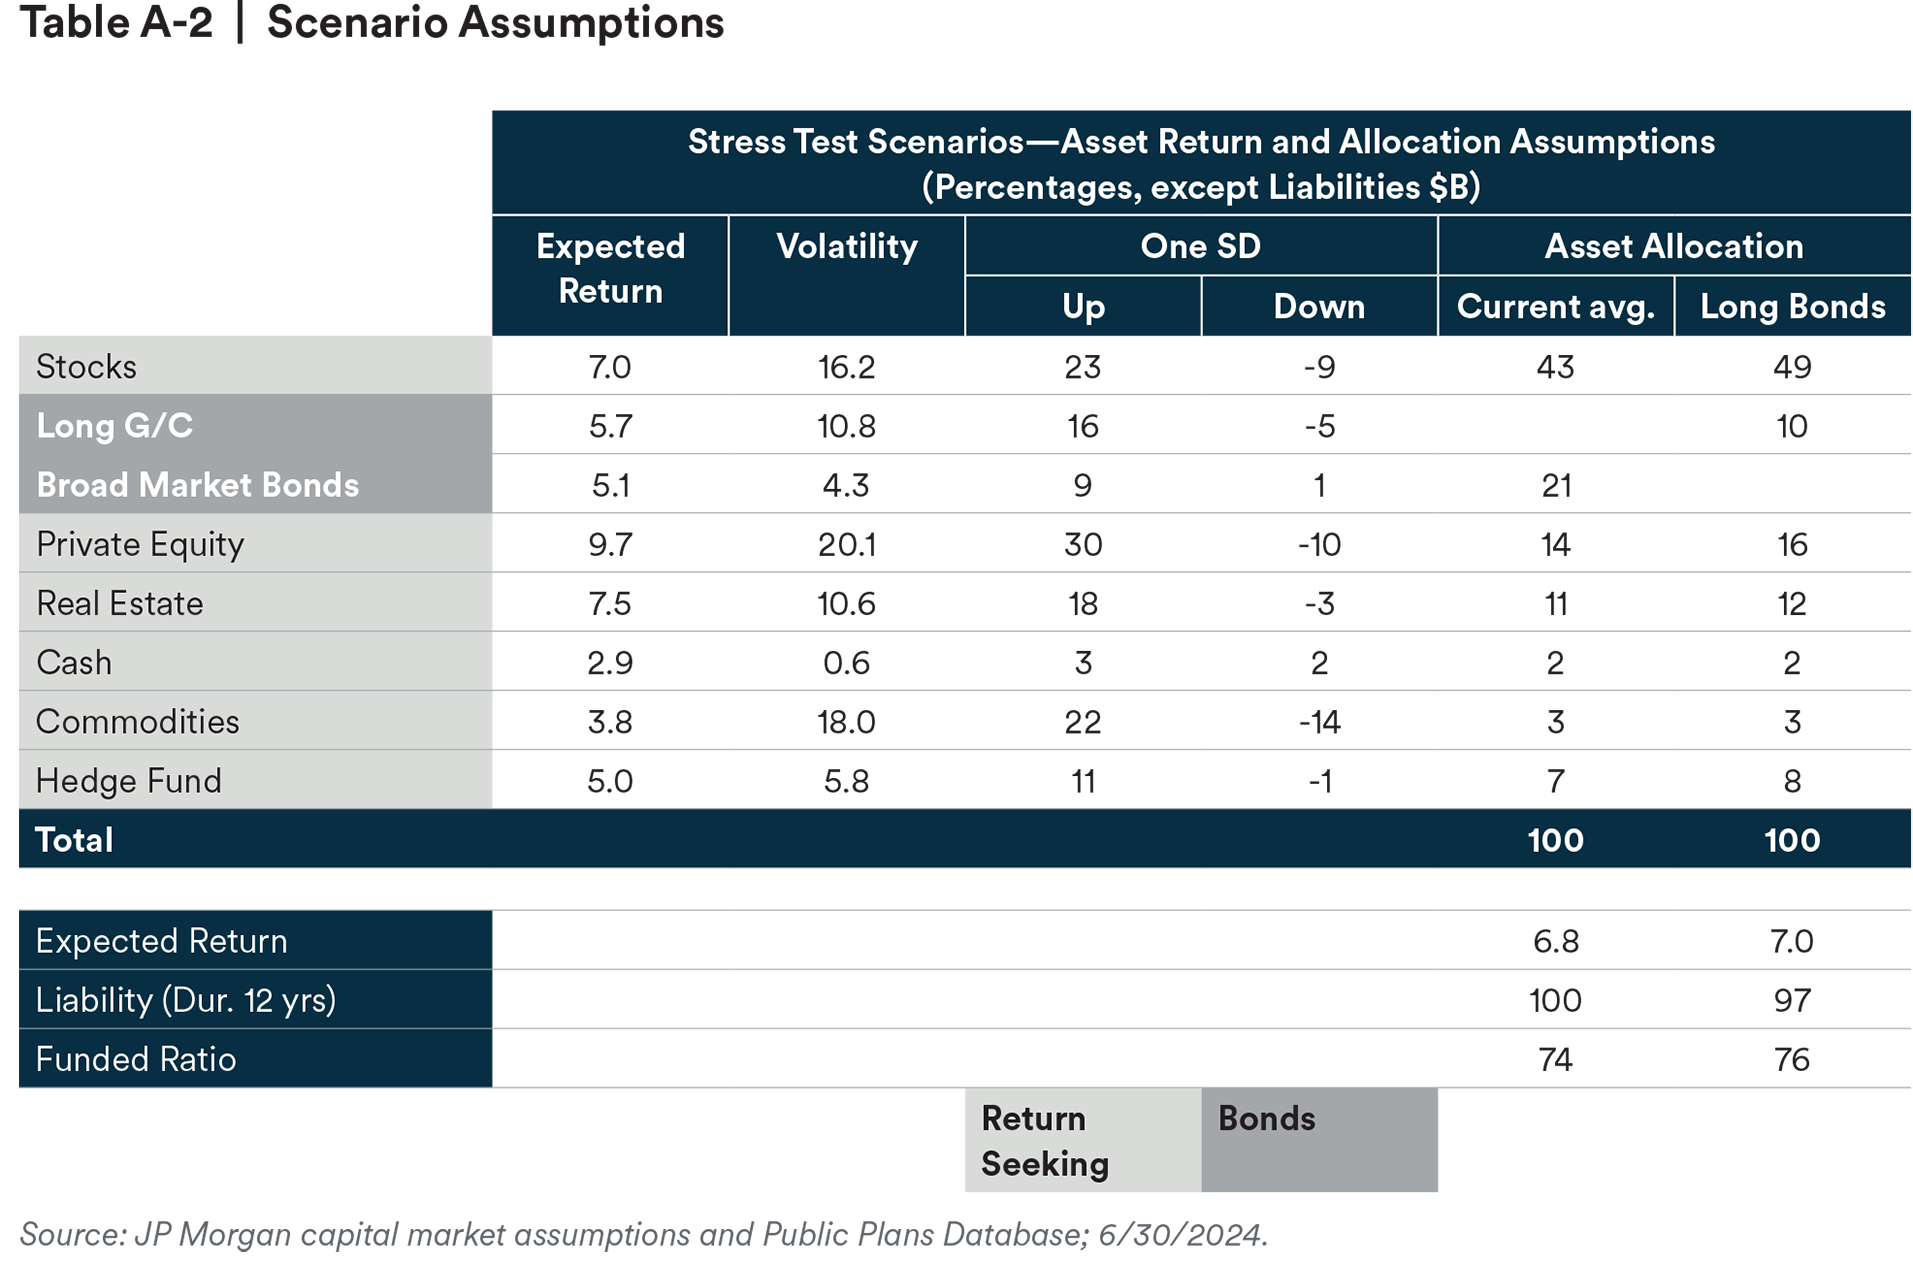
The illustrations use capital market assumptions as of 6/30/2024 and average public pension information from the Public Pensions Database. Table A-1 is copied from the Public Pensions Database and shows the average public pension plan asset allocation. For modeling purposes, the 0.1% in “Other” and the 1.8% in “Misc. Alternatives” have been distributed pro-rata across the other return seeking investments.
The scenarios represent shocks to each asset class of one standard deviation from their expected return. We have shown four scenarios that represent combinations of up and down for return seeking assets (stocks and alternatives) and bonds. In each of the four scenarios, Chart 5 shows the resulting asset returns and the funded status for both the average asset allocation and the Long G/C alternative.
To estimate the impact of a higher discount rate on funded ratio, we assumed the pension liabilities have a duration of 12 years. The shocks are assumed to occur over short periods of time, i.e. instantaneous shocks. The projections are simplified to illustrate the impact of the alternative bond allocation. They do not include the impacts of interest cost or service cost. Table A-2 provides additional detail.


Footnotes:
1 The Bloomberg U.S. Long Government/Credit index is property of Bloomberg LLC and MetLife Investment Management has no relationship with the index.
2 There has been a trend within both the accounting and actuarial rules for public pensions to measure liabilities using discount rates that reflect current fixed income market conditions. In some ways this trend mirrors the 20-year trend that moved pensions to liability driven investing. However fundamental differences remain between the accounting and funding rules for corporate and public pensions, and these keep their investment risk/return objectives distinct. GASB 67 and 68 were effective June 15, 2013, and June 15, 2014, respectively and ASOP 4, Measuring Pension Obligations and Determining Pension Plan Costs or Contributions was modified effective February 15, 2023. Each of these had elements like changes in corporate pension accounting and funding standards years earlier that eventually contributed to the widespread adoption of liability driven investing by corporate pension sponsors.
3 Bloomberg Long Government/Credit values are as of and through 6/30/2024. 4 S&P
Global, Default, Transition, and Recovery: 2023 Annual Global Corporate Default and Rating Transition Study.
Disclaimer
This material is intended solely for Institutional Investors, Qualified Investors and Professional Investors. This analysis is not intended for distribution with Retail Investors.
This document has been prepared by MetLife Investment Management (“MIM”)1 solely for informational purposes and does not constitute a recommendation regarding any investments or the provision of any investment advice, or constitute or form part of any advertisement of, offer for sale or subscription of, solicitation or invitation of any offer or recommendation to purchase or subscribe for any securities or investment advisory services. The views expressed herein are solely those of MIM and do not necessarily reflect, nor are they necessarily consistent with, the views held by, or the forecasts utilized by, the entities within the MetLife enterprise that provide insurance products, annuities and employee benefit programs. The information and opinions presented or contained in this document are provided as of the date it was written. It should be understood that subsequent developments may materially affect the information contained in this document, which none of MIM, its affiliates, advisors or representatives areunder an obligation to update, revise or affirm. It is not MIM’s intention to provide, and you may not rely on this document as providing, a recommendation with respect to any particular investment strategy or investment. Affiliates of MIM may perform services for, solicit business from, hold long or short positions in, or otherwise be interested in the investments (including derivatives) of any company mentioned herein. This document may contain forward-looking statements, as well as predictions, projections and forecasts of the economy or economic trends of the markets, which are not necessarily indicative of the future. Any or all forward-looking statements, as well as those included in any other material discussed at the presentation, may turn out to be wrong.
All investments involve risks including the potential for loss of principle and past performance does not guarantee similar future results. Property is a specialist sector that may be less liquidand produce more volatile performance than an investment in other investment sectors. The value of capital and income will fluctuate as property values and rent al income rise and fall. The valuation of property is generally a matter of the valuers’ opinion rather than fact. The amount raised when a property is sold
may be less than the valuation. Furthermore, certain investments in mortgages, real estate or non-publicly traded securities and private debt instruments have a limited number of potential purchasers and sellers. This factor may have the effect of limiting the availability of these investments for purchase and may also limit the ability to sell such investments at their fair market value in response to changes in the economy or the financial markets.
In the U.S. this document is communicated by MetLife Investment Management, LLC (MIM, LLC), a U.S. Securities Exchange Commission
registered investment adviser. MIM, LLC is a subsidiary of MetLife, Inc. and part of MetLife Investment Management. Registration with the SEC does not imply a certain level of skill or that the SEC has endorsed the investment advisor.
1MetLife Investment Management (“MIM”) is MetLife, Inc.’s institutional management business and the marketing name for subsidiaries of MetLife that provide investment management services to MetLife’s general account, separate accounts and/or unaffiliated/ third party investors, including: Metropolitan Life Insurance Company, MetLife Investment Management, LLC, MetLife Investment Management Limited, MetLife Investments Limited, MetLife Investments Asia Limited, MetLife Latin America Asesorias e
Inversiones Limitada, MetLife Asset Management Corp. (Japan), and MIM I LLC, MetLife Investment Management Europe Limited and Affirmative Investment
Management Partners Limited.


