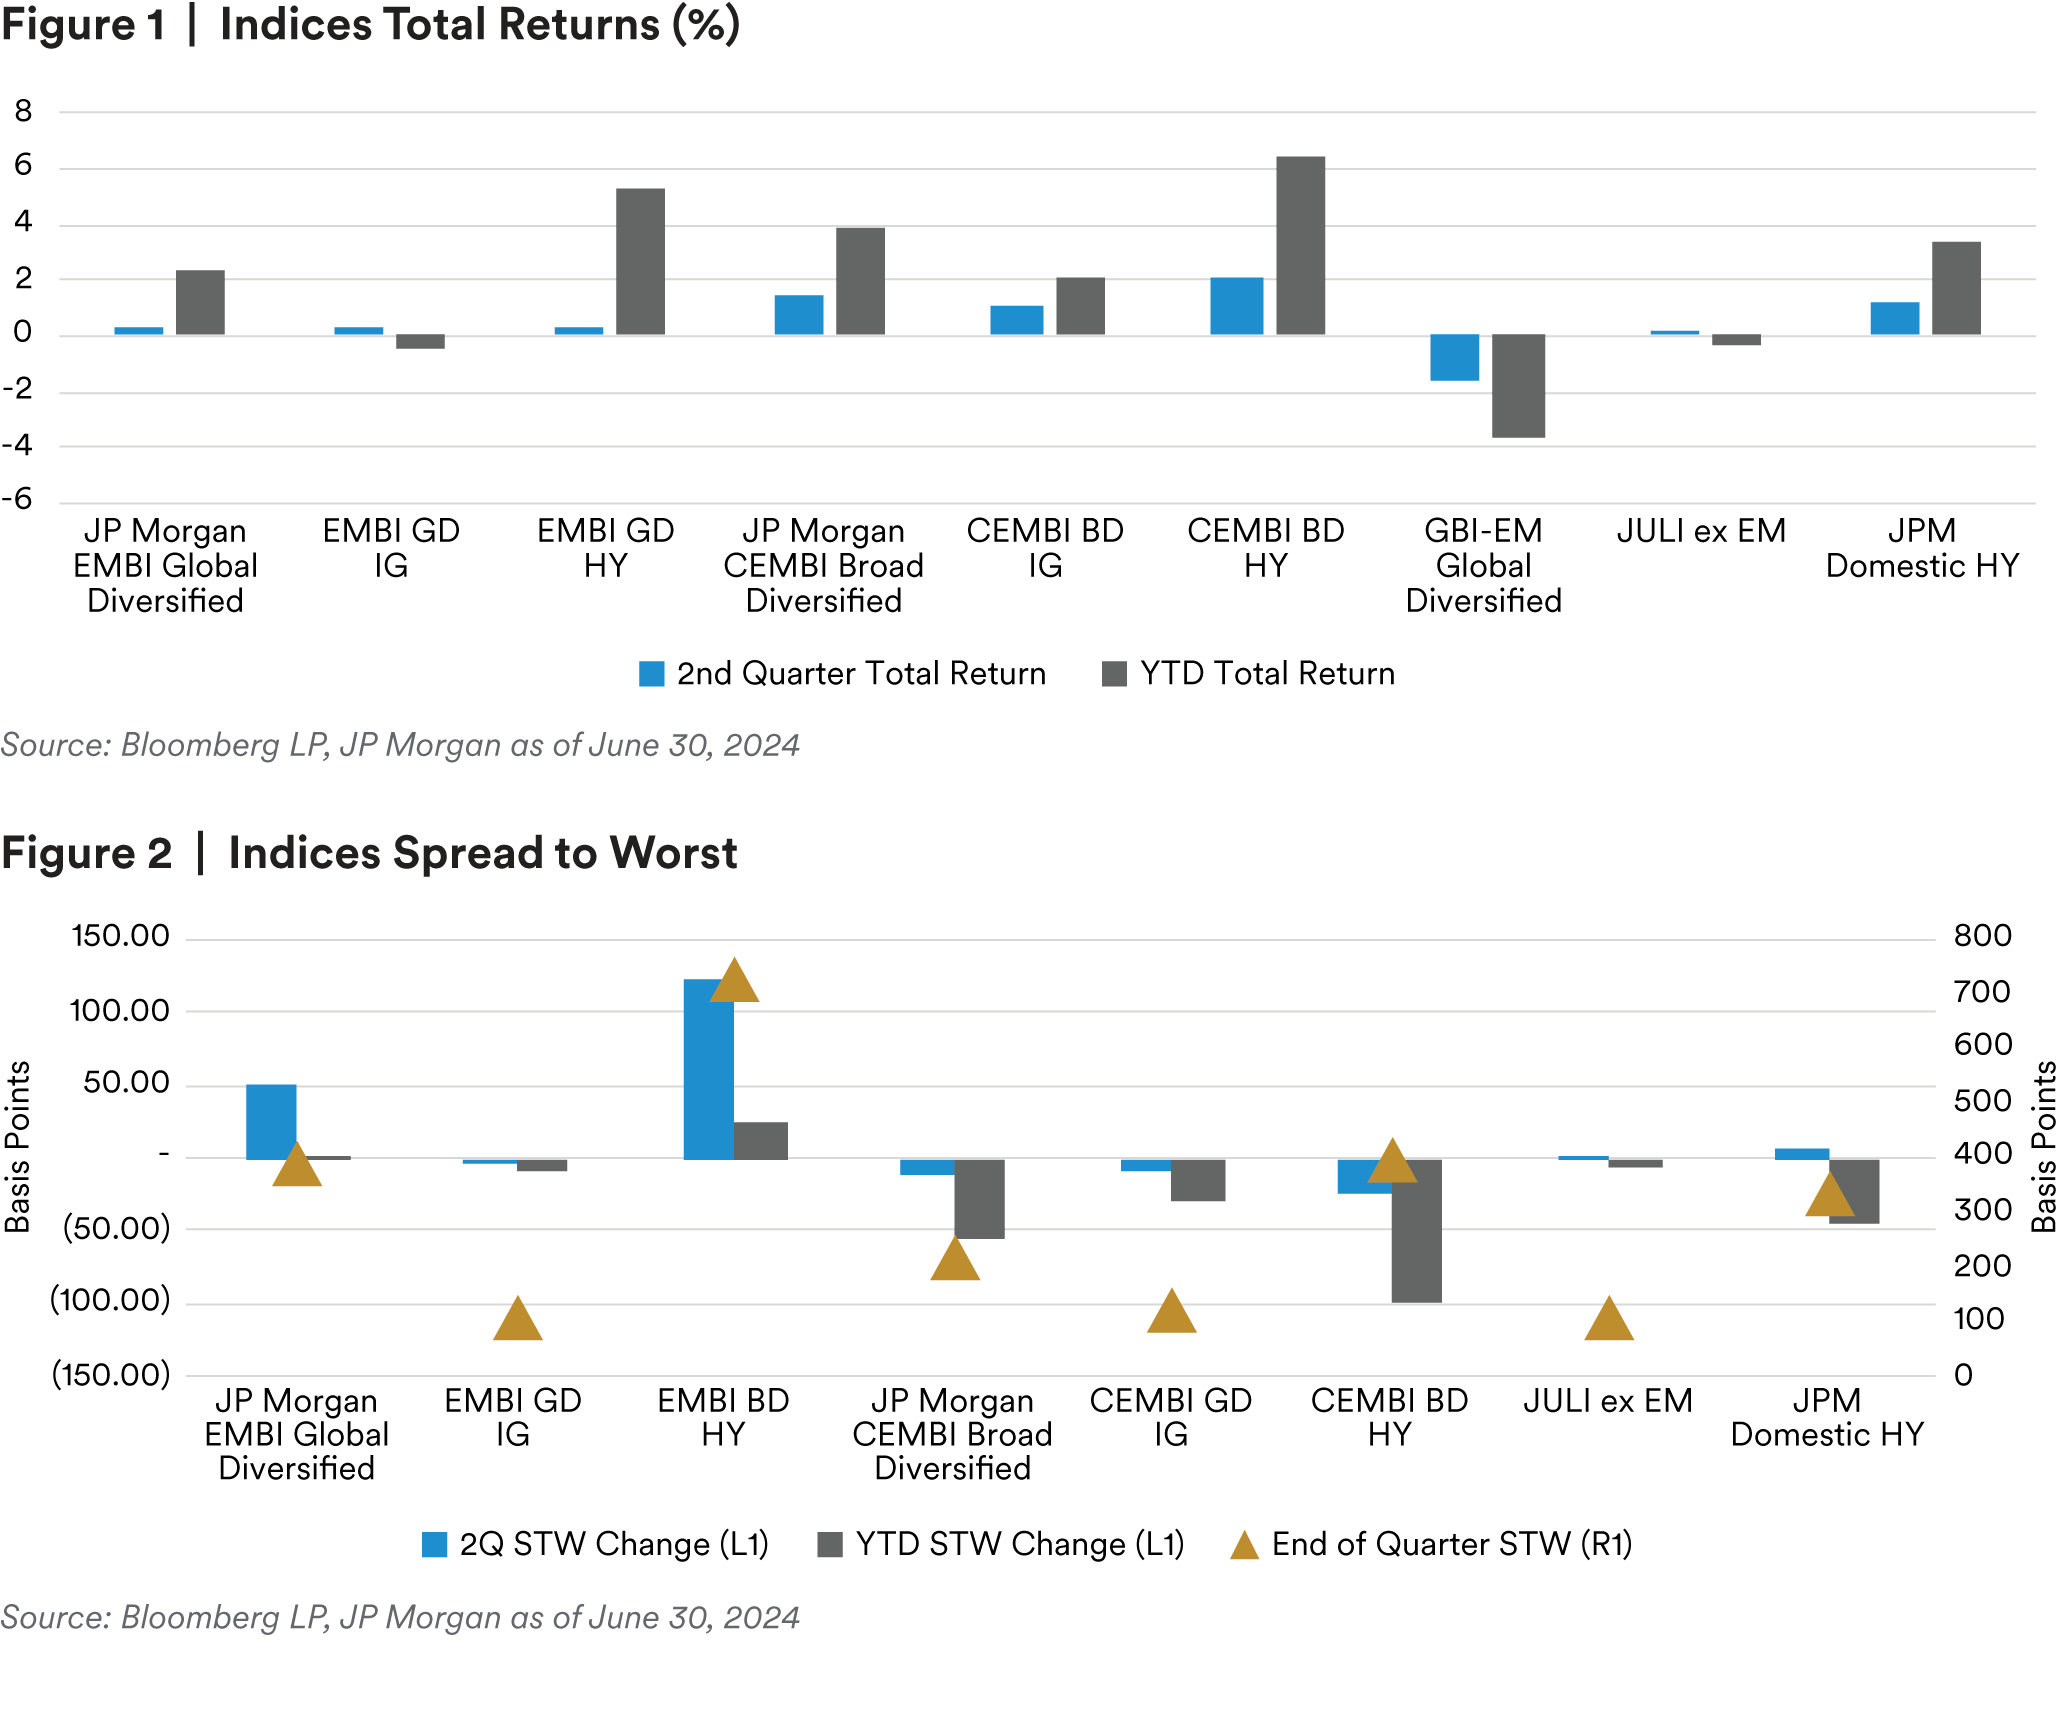
Brent crude saw some volatility within the quarter, closing down 1.2% at $86.412. Rising summer demand, consistent OPEC output in Q2, and Middle Eastern tensions drove energy prices above $85 a barrel. Meanwhile, gold and copper have been bolstered by supply crunches and robust demand, with gold continuing to be a go-to asset amid global political and geopolitical uncertainties.
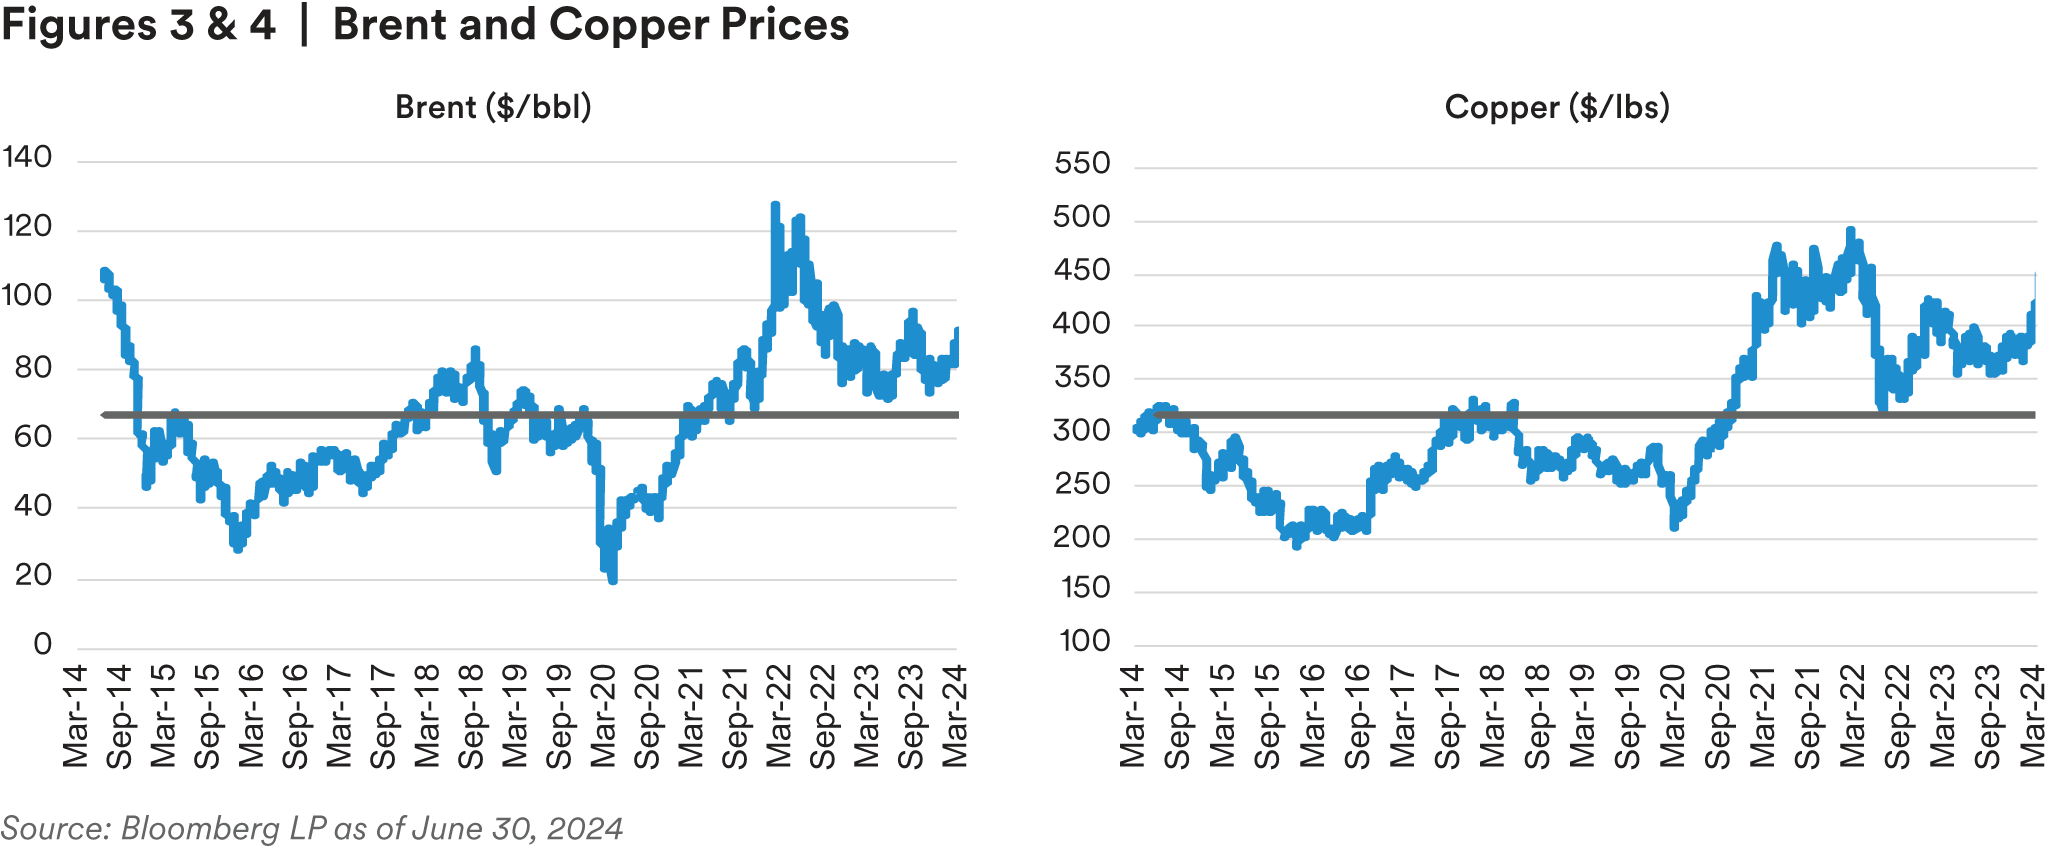
Investors gearing up for a quieter summer are leaning towards the carry trade, favoring popular trades like Mexico and the Dominican Republic. This supported BBB and BB sovereigns and corporates, providing attractive spread without the risks associated with idiosyncratic credits in the higher beta space. Yet the carry trade also supported some of these less liquid frontier markets such as Tajikistan, Zambia, and Suriname as double-digit yields enticed investors. Further, single-B corporates were the best performing EM sub-set by rating, supported by a rally in China property assets3.
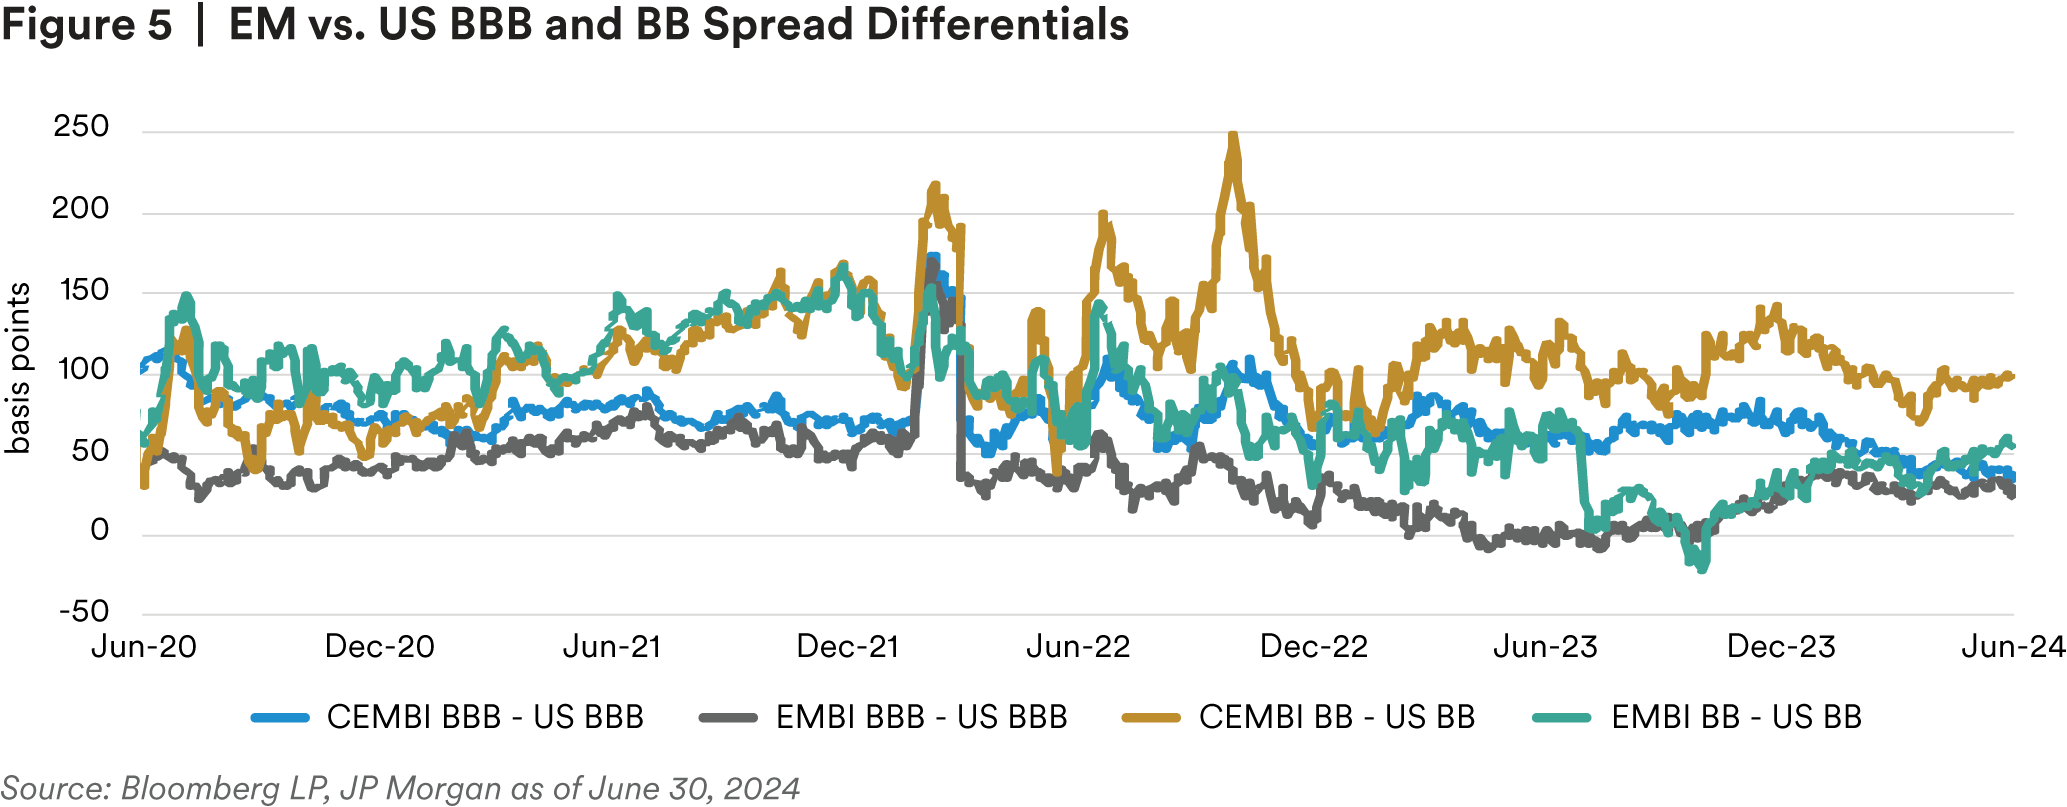
China property remains in the spotlight as the country continues searching for ways to support the sector and boost overall economic growth. Property names saw some strength during Q2 after local governments began removing home buying restrictions with the hope of increasing demand and improving market sentiment.
Shanghai’s latest housing policy adjustment in May included the relaxation of qualification for property purchases, funding costs, and down payment ratios. While the data has yet to show material improvements from these measures, the optimism around sector support helped bond prices rally.
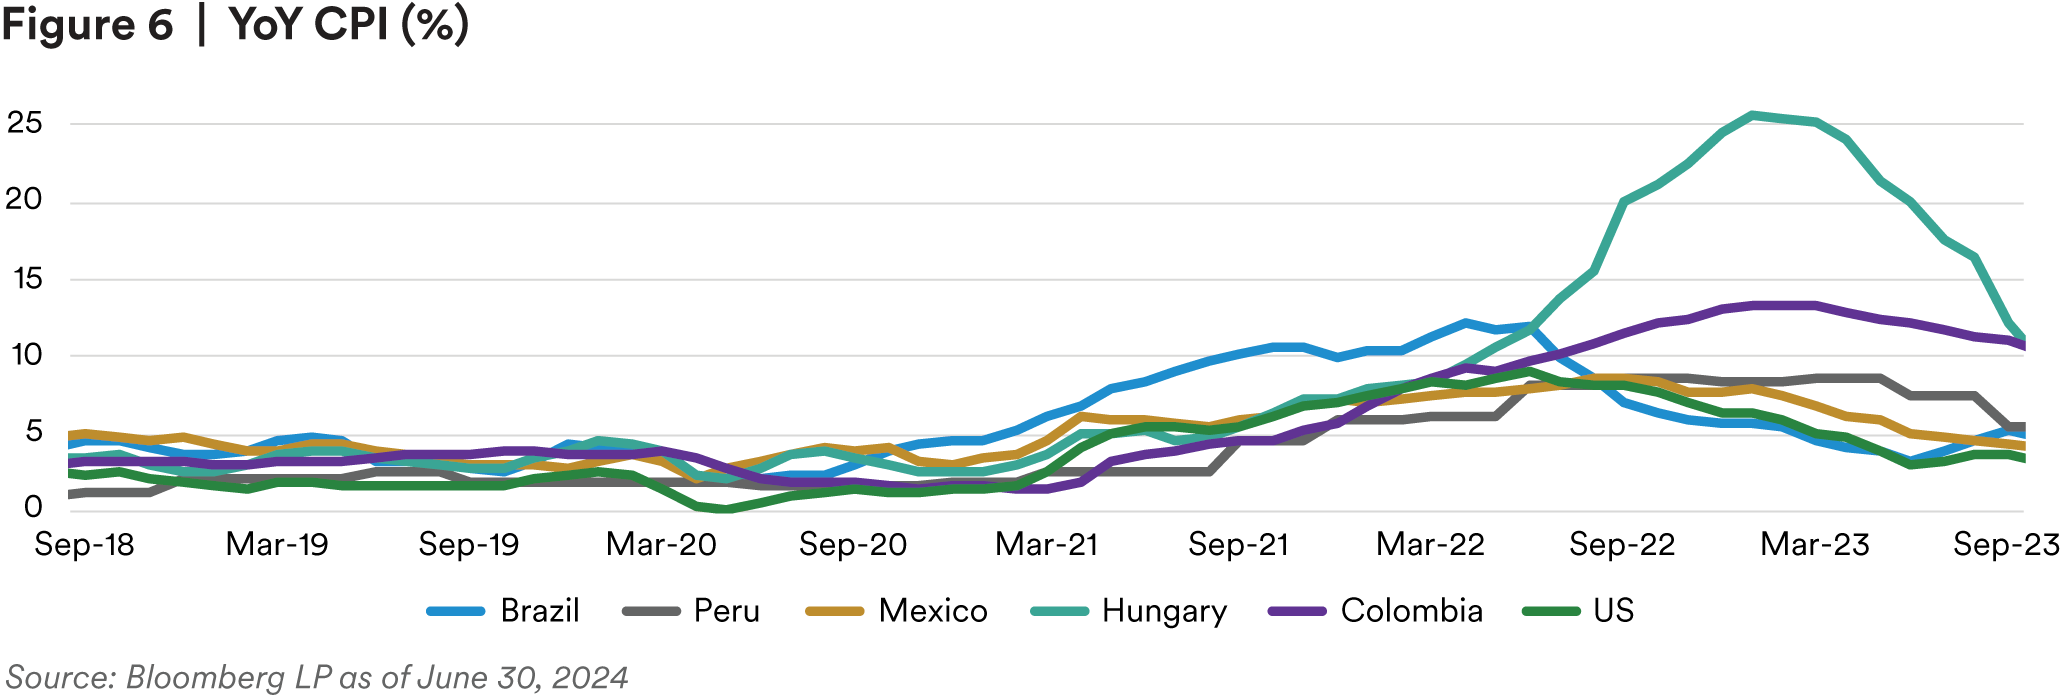
While hard currency assets continued to post positive returns, local currency assets witnessed another challenging quarter. At large, EM currencies were pressured by prolonged dollar strength. As EM countries have done a respectable job curbing inflation and subsequently cutting rates, the US “higher for longer” environment has pressured EM local assets. Further, idiosyncratic stories both positively and negatively impacted currencies in countries including Mexico, South Africa, and Brazil. Brazil local was the worst performer as President Lula has not been able to ease investor skepticism around Brazil reaching its fiscal goals for the year. The president’s undermining of spending cuts and concerns around a dovish central bank pivot when BCB President Neto culminates his position at year end have weighed on the currency.
EM countries witnessed surprising outcomes during Q2 elections in Mexico, India, and South Africa. Mexico’s controlling left-winged party achieved close to a super majority of seats across the government as ruling coalition candidate Claudia Sheinbaum was elected president. Mexican assets sold off on the outcome with local currency significantly underperforming due to a combination of worries around Morena policies and crowded positioning. We believe the concerns are overdone given the move but acknowledge policy continuity is less certain than originally thought. South African and Indian elections resulted in legislative bodies that are more fragmented than expected; therefore, the controlling parties will need to work with coalition partners to get things done. The news was taken positively in South Africa as the ANC party announced the formation of a government of national unity including opposition party DA. The rand rose past 18 per dollar for the first time in more than 10 months on the news4.
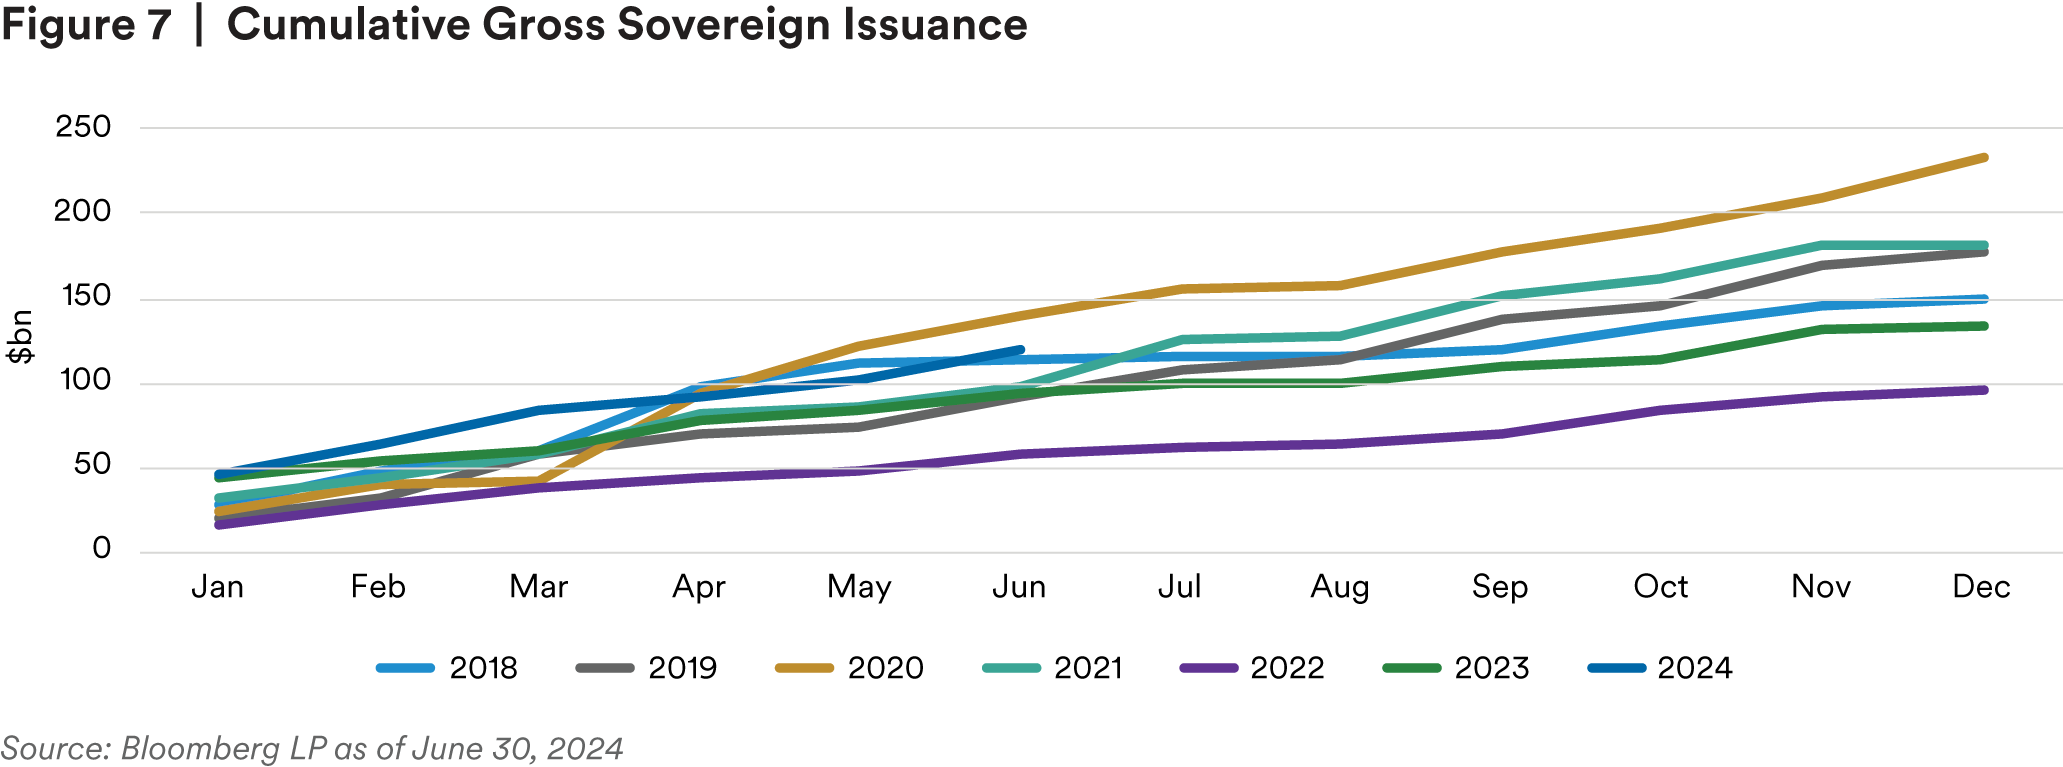
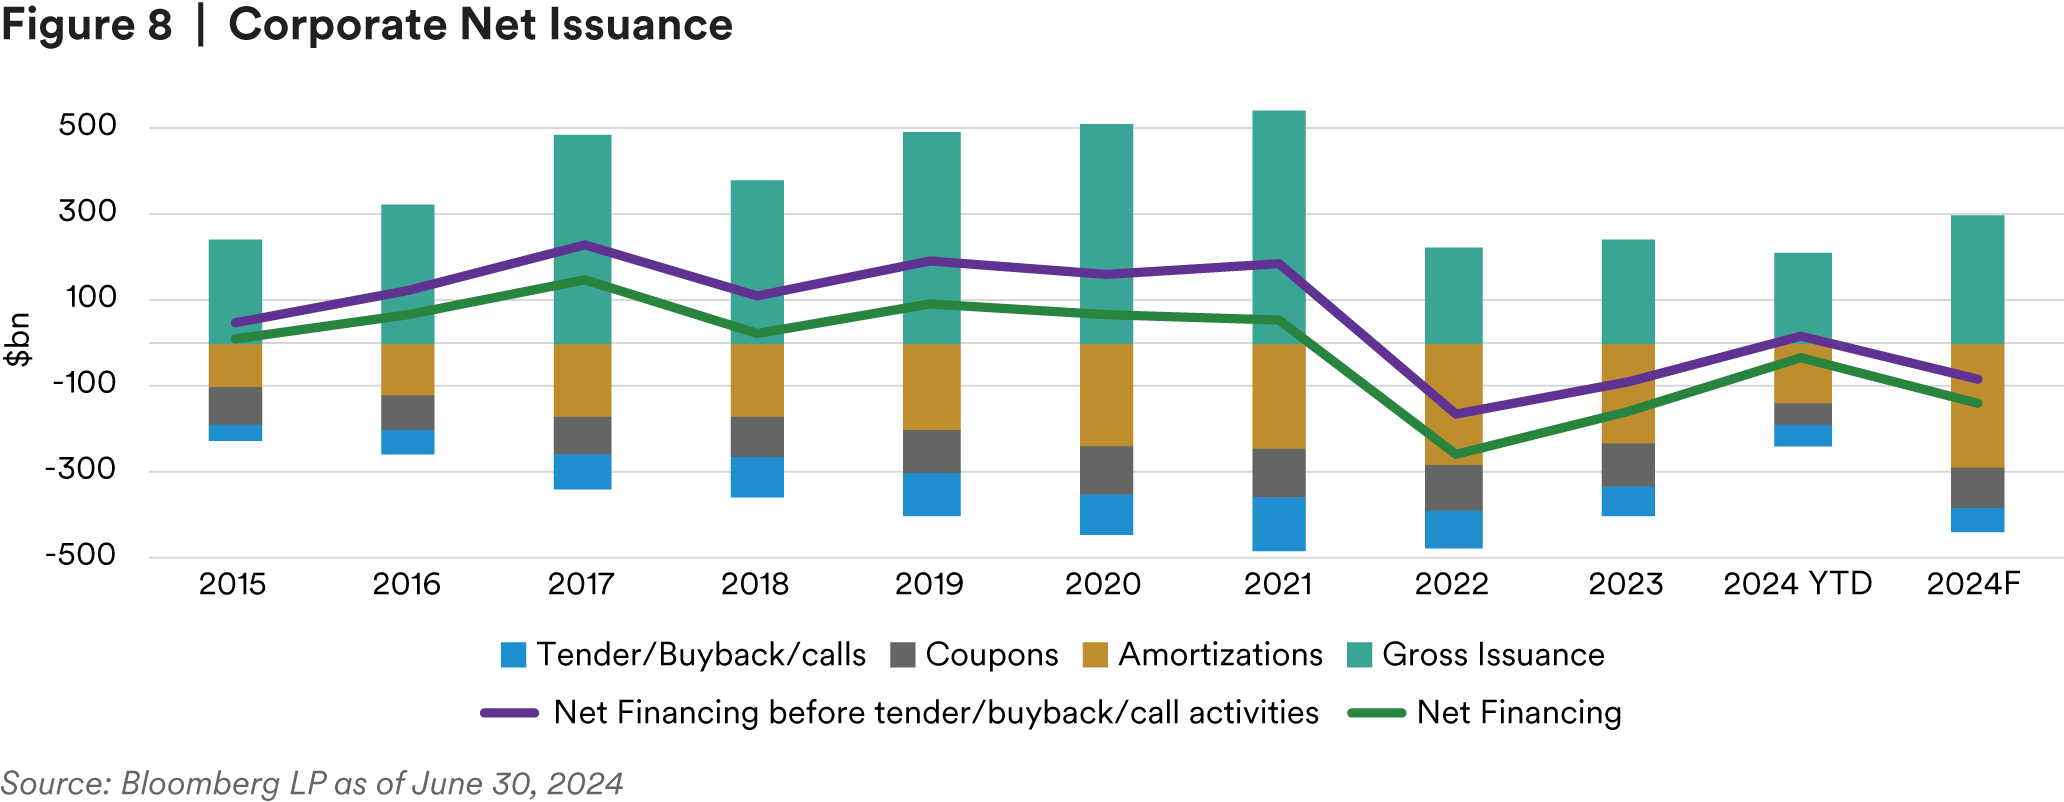
Receding rates coupled with low volatility and supportive investor appetite helped issuance remain active ahead of the summer months. Year-to-date (YTD) sovereign issuance of $120.3 billion represents 70% of expected issuance for the year. Favorable market conditions allowed high yield countries to access the market, with 23% of Q2 sovereign issuance coming from below investment grade names. While Q2 corporate issuance of $96 billion is over 50% higher than the same period last year, it remains below the five-year average for the quarter. Similar to sovereigns, $209 billion of corporate issuance YTD represents 70% of the expected corporate primary deals for 2024. While gross issuance was notable, robust cashflows caused corporate net financing to turn negative (-$35 billion) in the second quarter. EM dedicated flows saw a slight uptick during Q2 but remained lackluster until the end of June. Hard currency bond funds seeing the largest inflows since January 2023 in the last week of the quarter, bringing YTD bond flows to -$13.0 billion5.
Outlook
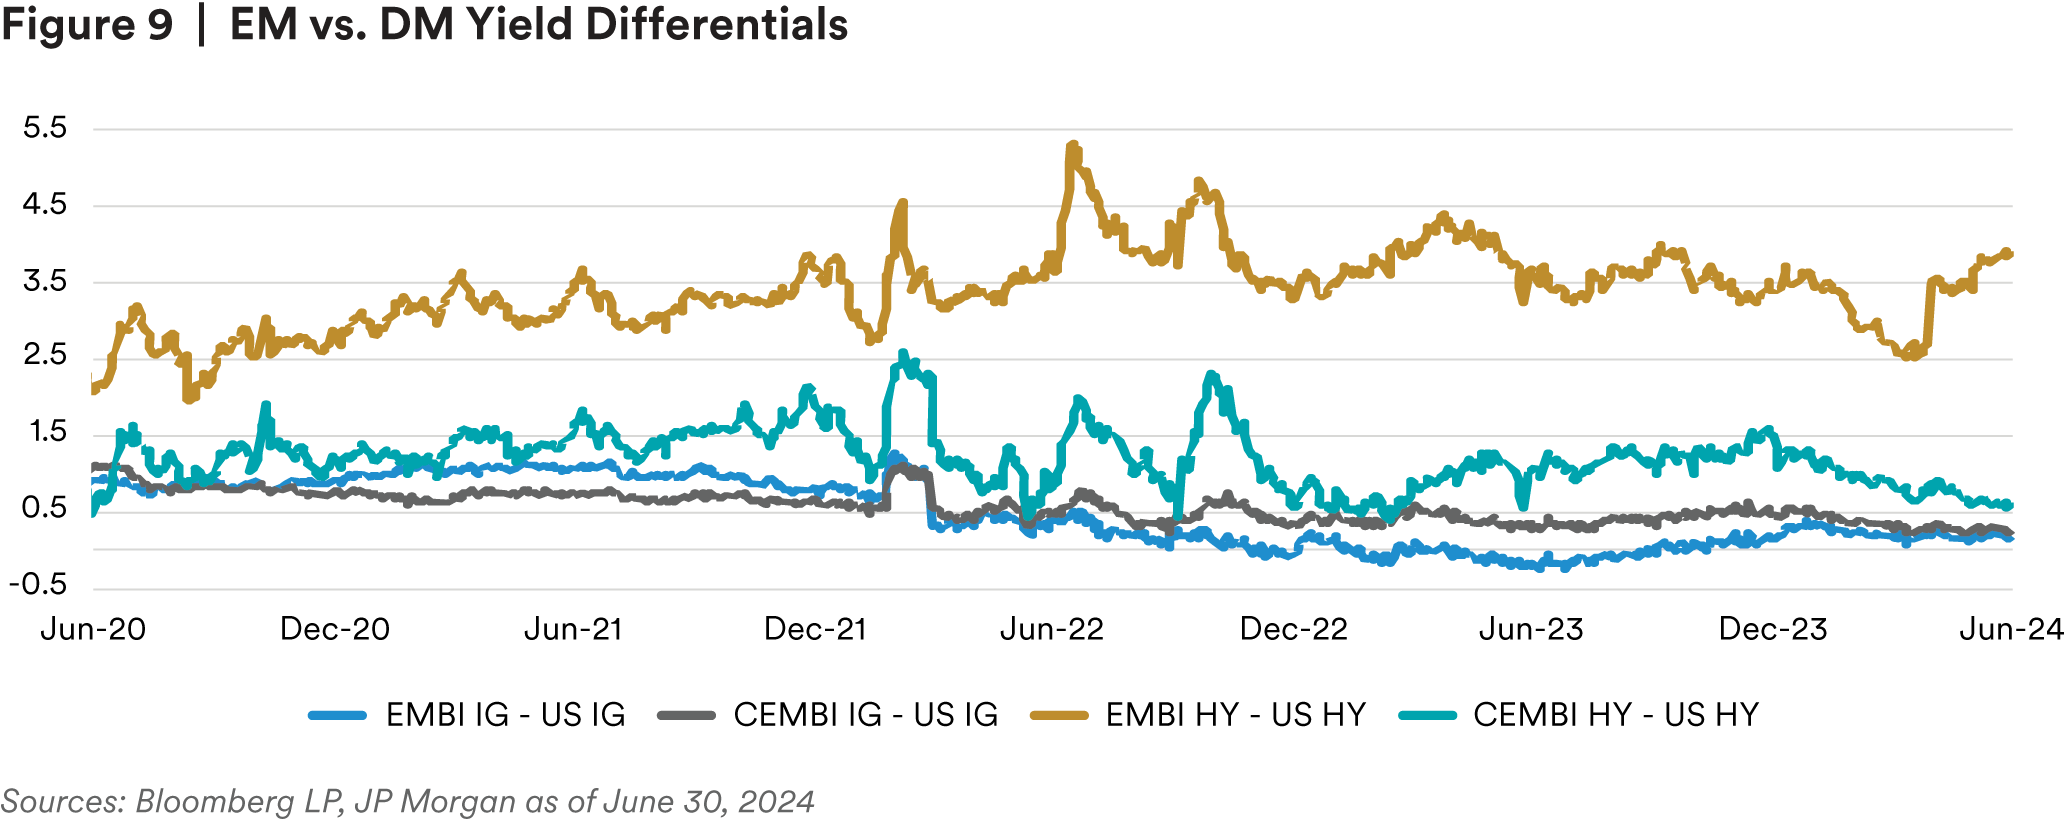
As we close out the second quarter, EM spreads remain attractive relative to Developed Markets (DM) especially as we move down the credit spectrum. However, the upcoming US election and, more importantly, the campaign rhetoric could keep new allocations to the asset class on the lighter side. A confluence of factors including trade, globalization, defense spending, and China will be highly anticipated hot topics. As we enter summer months, liquidity will be more constrained which could lead to bouts of elevated volatility; however, we do not expect any policy shifts that will significantly shift the fundamental dynamics. As a result, we believe there may be opportunities to add EM risk into increased election driven uncertainty at attractive valuations. During the near term, we are more optimistic on portfolio positioning and have increased beta, as the path of US interest rates has become marginally clearer and is a large driver of performance and sentiment. We continue looking for a combination of the US inflation slowing and a consistent rebound in China’s economy.
EM sovereign fundamentals have largely stabilized from the growth and inflation shocks since 2020. The EM growth differential versus DM is expanding, and EM growth is more balanced. Most countries are running at or above potential, with commodity exporters and those more exposed to China seeing a drag. Aggressive central bank hiking has led to inflation coming down from peaks seen in 2022 and while some central banks have begun to ease, most remain on hold in restrictive territory. Ratings trajectory is also balanced, with roughly 1/3 of EM countries facing downgrade risk due to rising debt dynamics that require some fiscal adjustment, and only one IG country is at elevated risk of descending into HY territory over the next 12-18 months6.
We continue to have a bias towards high yield over investment grade sovereigns. We like idiosyncratic opportunities including restructuring stories as well as countries going through elections and subsequent positive policy reform. Within the IG space, we like low-BBB sovereigns in the 7-10 year part of the curve where all in yields screen attractive. Our preference is for countries who face low financing needs or have demonstrated ability to tap the market.
Fundamentals of EM corporates and banks remain healthy, and we acknowledge that metrics may moderate while staying resilient. Balance sheets remain strong and active liability management has led to reduced concerns over refinancing risks. Successful liability management has pushed out the maturity wall, notably for higher quality issuers. While we do not expect debt levels to change materially, we expect EBIDTA to decline from recent highs. This may show an uptick in leverage, while remaining at manageable levels. Free cash flow should remain strong as capital expenditures continues to focus on maintenance rather than expansion. Default rates have remained below expectations, with the default rate of 1.8% YTD largely driven by the China property space and idiosyncratic stories in Latin America. Noteworthy, the amount of outstanding HY bonds trading at distressed levels (spread-to- worst > 1000 basis points) dropped a significant 7%, down to 9.2% of the EM Corporate HY universe7.
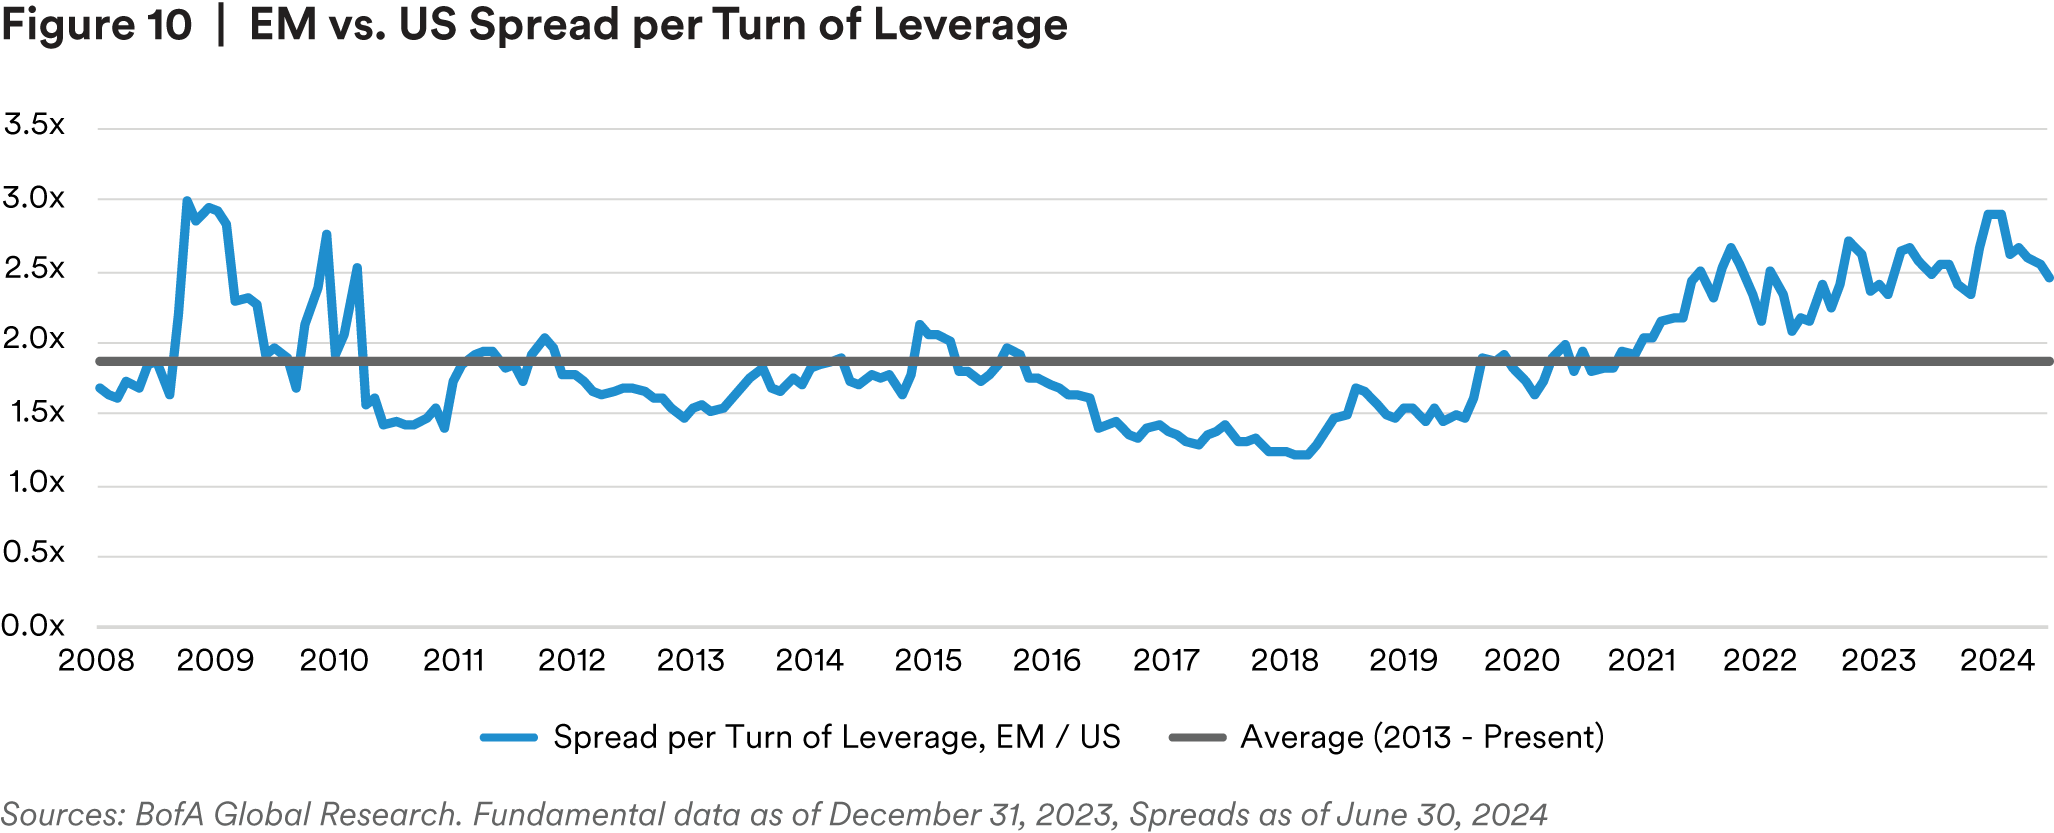
We continue to see opportunities in BB and BBB corporates, in sectors that generate hard currency revenues or have effective FX liability management. Even with the outperformance of EM corporates relative to DM YTD, the spread per turn of leverage remains over double, 49 bps/x for US credits versus 120 bps/x for Global EM8. In the utility space, we see value in assets with consistent cashflows that have strong structures, especially within Latin America. Infrastructure projects in the Middle East are enticing, where we can get a pickup of ~100bps over comparable DM credits.
We like idiosyncratic opportunities including restructuring stories as well as countries going through elections and subsequent positive policy reform.
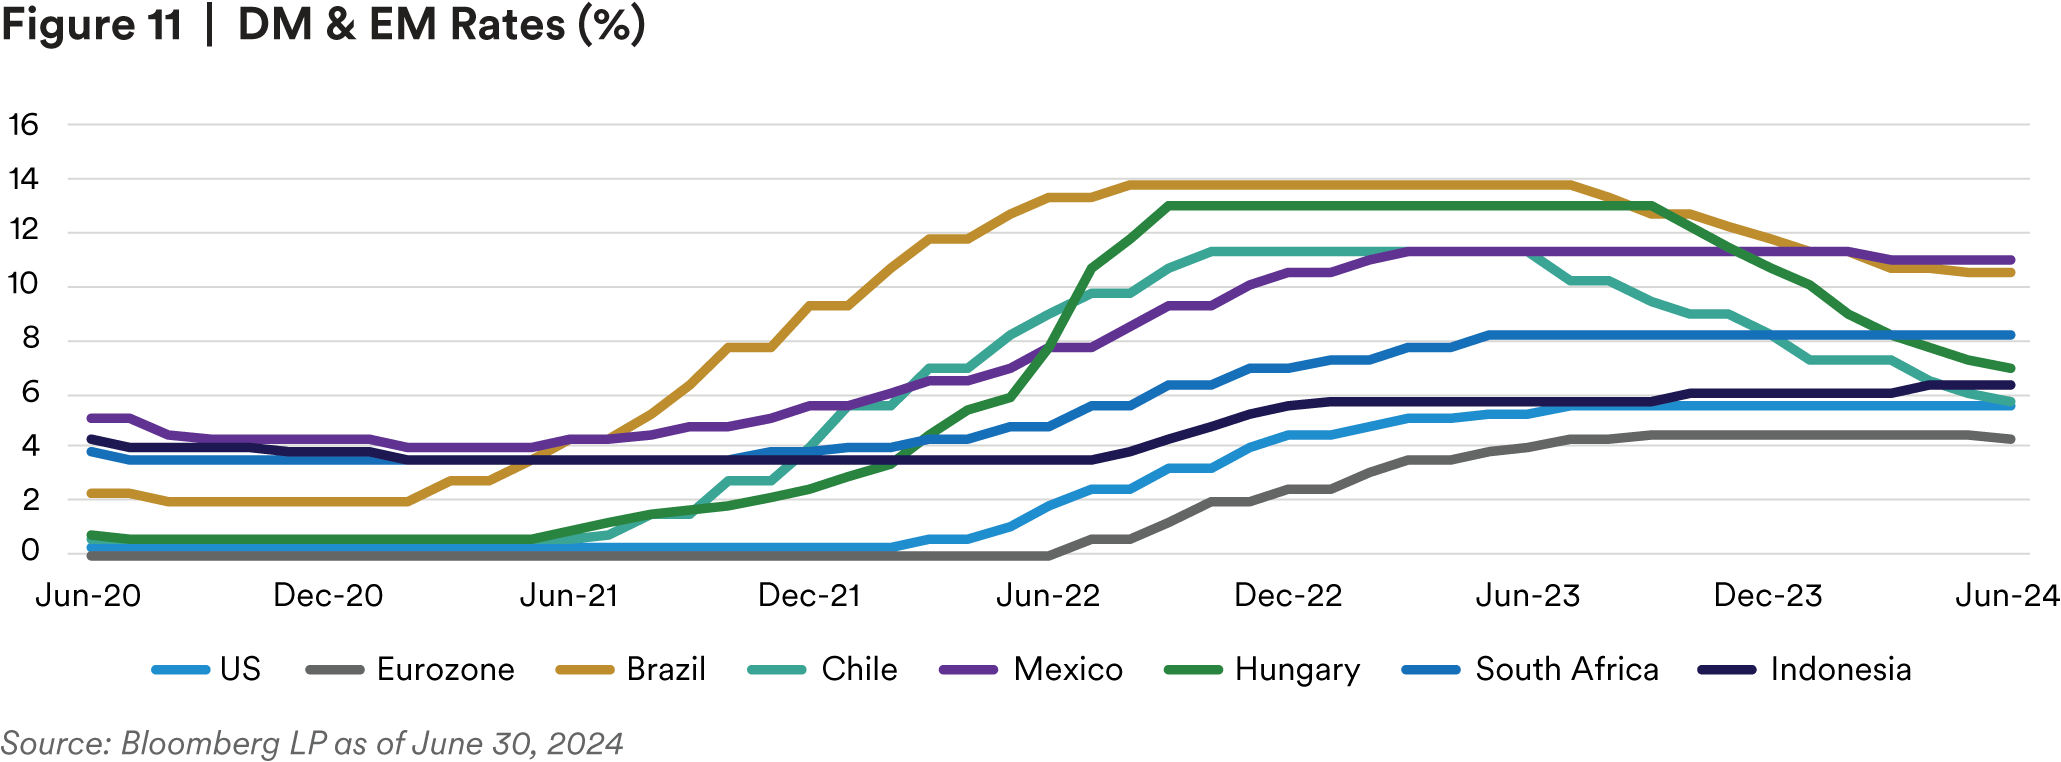
Local currency valuations look attractive relative to hard currency assets. While EM inflation has been steadily receding, EM bond yields have not moved accordingly, leaving us with the highest real yield levels seen since 2009. Local yields have underperformed YTD primarily due to monetary policy divergence. EM countries including Chile, Hungary, and others are cutting rates as their inflation rates converge towards target while the path for the Fed remains less clear. However, this divergence feels poised to change in the later half of 2024 as federal reserve policy is more likely to be reduced. This environment will allow investors to capitalize on attractive real yields across the local space as well as provide more confidence going down into the more idiosyncratic hard currency stories. Our preference is within local currency markets which have significant yield compression possibilities while capturing robust real yields. The compelling real rate environment in Latin America is most enticing, while Europe is valued more fairly, and Asian local yields are overall lower and therefore less compelling.
Endnotes
1 Bloomberg LP
2 Bloomberg LP
3 Information in this paragraph sourced from JP Morgan
4 Bloomberg LP
5 Information in this paragraph sourced from JP Morgan
6 MIM
7 BofA Global Research
8 BofA Global Research
Information has been obtained from sources believed to be reliable but J.P. Morgan does not warrant its completeness or accuracy. The Index is used with permission. The Index may not be copied, used, or distributed without J.P. Morgan prior written approval. Copyright 2024, J.P. Morgan Chase $ Co.All rights reserved.
Disclaimer
This material is intended solely for Institutional Investors, Qualified Investors and Professional Investors. This analysis is not intended for distribution with Retail Investors.
This document has been prepared by MetLife Investment Management (“MIM”)1 solely for informational purposes and does not constitute a recommendation regarding any investments or the provision of any investment advice, or constitute or form part of any advertisement of, offer for sale or subscription of, solicitation or invitation of any offer or recommendation to purchase or subscribe for any securities or investment advisory services. The views expressed herein are solely those of MIM and do not necessarily reflect, nor are they necessarily consistent with, the views held by, or the forecasts utilized by, the entities within the MetLife enterprise that provide insurance products, annuities and employee benefit programs. The information and opinions presented or contained in this document are provided as of the date it was written. It should be understood that subsequent developments may materially affect the information contained in this document, which none of MIM, its affiliates, advisors or representatives are under an obligation to update, revise or affirm. It is not MIM’s intention to provide, and you may not rely on this document as providing, a recommendation with respect to any particular investment strategy or investment. Affiliates of MIM may perform services for, solicit business from, hold long or short positions in, or otherwise be interested in the investments (including derivatives) of any company mentioned herein. This document may contain forward-looking statements, as well as predictions, projections and forecasts of the economy or economic trends of the markets, which are not necessarily indicative of the future. Any or all forward-looking statements, as well as those included in any other material discussed at the presentation, may turn out to be wrong.
All investments involve risks including the potential for loss of principle and past performance does not guarantee similar future results. Property is a specialist sector that may be less liquid and produce more volatile performance than an investment in other investment sectors. The value of capital and income will fluctuate as property values and rental income rise and fall. The valuation of property is generally a matter of the valuers’ opinion rather than fact. The amount raised when a property is sold may be less than the valuation. Furthermore, certain investments in mortgages, real estate or non-publicly traded securities and private debt instruments have a limited number of potential purchasers and sellers. This factor may have the effect of limiting the availability of these investments for purchase and may also limit the ability to sell such investments at their fair market value in response to changes in the economy or the financial markets.
In the U.S. this document is communicated by MetLife Investment Management, LLC (MIM, LLC), a U.S. Securities Exchange Commission registered investment adviser. MIM, LLC is a subsidiary of MetLife, Inc. and part of MetLife Investment Management. Registration with the SEC does not imply a certain level of skill or that the SEC has endorsed the investment advisor.
For investors in the Middle East: This document is directed at and intended for institutional investors (as such term is defined in the various jurisdictions) only. The recipient of this document acknowledges that (1) no regulator or governmental authority in the Gulf Cooperation Council (“GCC”) or the Middle East has reviewed or approved this document or the substance contained within it, (2) this document is not for general circulation in the GCC or the Middle East and is provided on a confidential basis to the addressee only, (3) MetLife Investment Management is not licensed or regulated by any regulatory or governmental authority in the Middle East or the GCC, and (4) this document does not constitute or form part of any investment advice or solicitation of investment products in the GCC or Middle East or in any jurisdiction in which the provision of investment advice or any solicitation would be unlawful under the securities laws of such jurisdiction (and this document is therefore not construed as such).
For investors in Japan: This document is being distributed by MetLife Investment Management Japan, Ltd. (“MIM JAPAN”) a registered Financial Instruments Business Operator (“FIBO”) under the registration entry Director General of the Kanto Local Finance Bureau (FIBO) No. 2414, a regular member of the Japan Investment Advisers Association and the Type II Financial Instruments Firms Association of Japan. As fees to be borne by investors vary depending upon circumstances such as products, services, investment period and market conditions, the total amount nor the calculation methods cannot be disclosed in advance. All investments involve risks including the potential for loss of principle and past performance does not guarantee similar future results. Investors should obtain and read the prospectus and/or document set forth in Article 37-3 of Financial Instruments and Exchange Act carefully before making the investments.
For Investors in Hong Kong S.A.R.: This document is being issued by MetLife Investments Asia Limited (“MIAL”), a part of MIM, and it has not been reviewed by the Securities and Futures Commission of Hong Kong (“SFC”). MIAL is licensed by the Securities and Futures Commission for Type 1 (dealing in securities), Type 4 (advising on securities) and Type 9 (asset management) regulated activities.
For investors in Australia: This information is distributed by MIM LLC and is intended for “wholesale clients” as defined in section 761G of the Corporations Act 2001 (Cth) (the Act). MIM LLC exempt from the requirement to hold an Australian financial services license under the Act in respect of the financial services it provides to Australian clients. MIM LLC is regulated by the SEC under US law, which is different from Australian law.
MIMEL: For investors in the EEA, this document is being distributed by MetLife Investment Management Europe Limited (“MIMEL”), authorised and regulated by the Central Bank of Ireland (registered number: C451684), registered address 20 on Hatch, Lower Hatch Street, Dublin 2, Ireland. This document is approved by MIMEL as marketing communications for the purposes of the EU Directive 2014/65/EU on markets in financial instruments (“MiFID II”). Where MIMEL does not have an applicable cross-border licence, this document is only intended for, and may only be distributed on request to, investors in the EEA who qualify as a “professional client” as defined under MiFID II, as implemented in the relevant EEA jurisdiction. The investment strategies described herein are directly managed by delegate investment manager affiliates of MIMEL. Unless otherwise stated, none of the authors of this article, interviewees or referenced individuals are directly contracted with MIMEL or are regulated in Ireland. Unless otherwise stated, any industry awards referenced herein relate to the awards of affiliates of MIMEL and not to awards of MIMEL.
1 As of July 22, 2024, subsidiaries of MetLife, Inc. that provide investment management services to MetLife’s general account, separate accounts and/ or unaffiliated/third party investors include Metropolitan Life Insurance Company, MetLife Investment Management, LLC, MetLife Investment Management Limited, MetLife Investments Limited, MetLife Investments Asia Limited, MetLife Latin America Asesorias e Inversiones Limitada, MetLife Investment Management Japan, Ltd., MIM I LLC, MetLife Investment Management Europe Limited and Affirmative Investment Management Partners Limited


