This leads us to two observations from the second quarter:
- Most of the damage to Taxable Municipal returns was inflicted by higher rates. To the extent that rates have recalibrated to the aggressive trajectory of rate hikes, most of the damage may already be done and return prospects for the second half of the year should be much more favorable in our view.
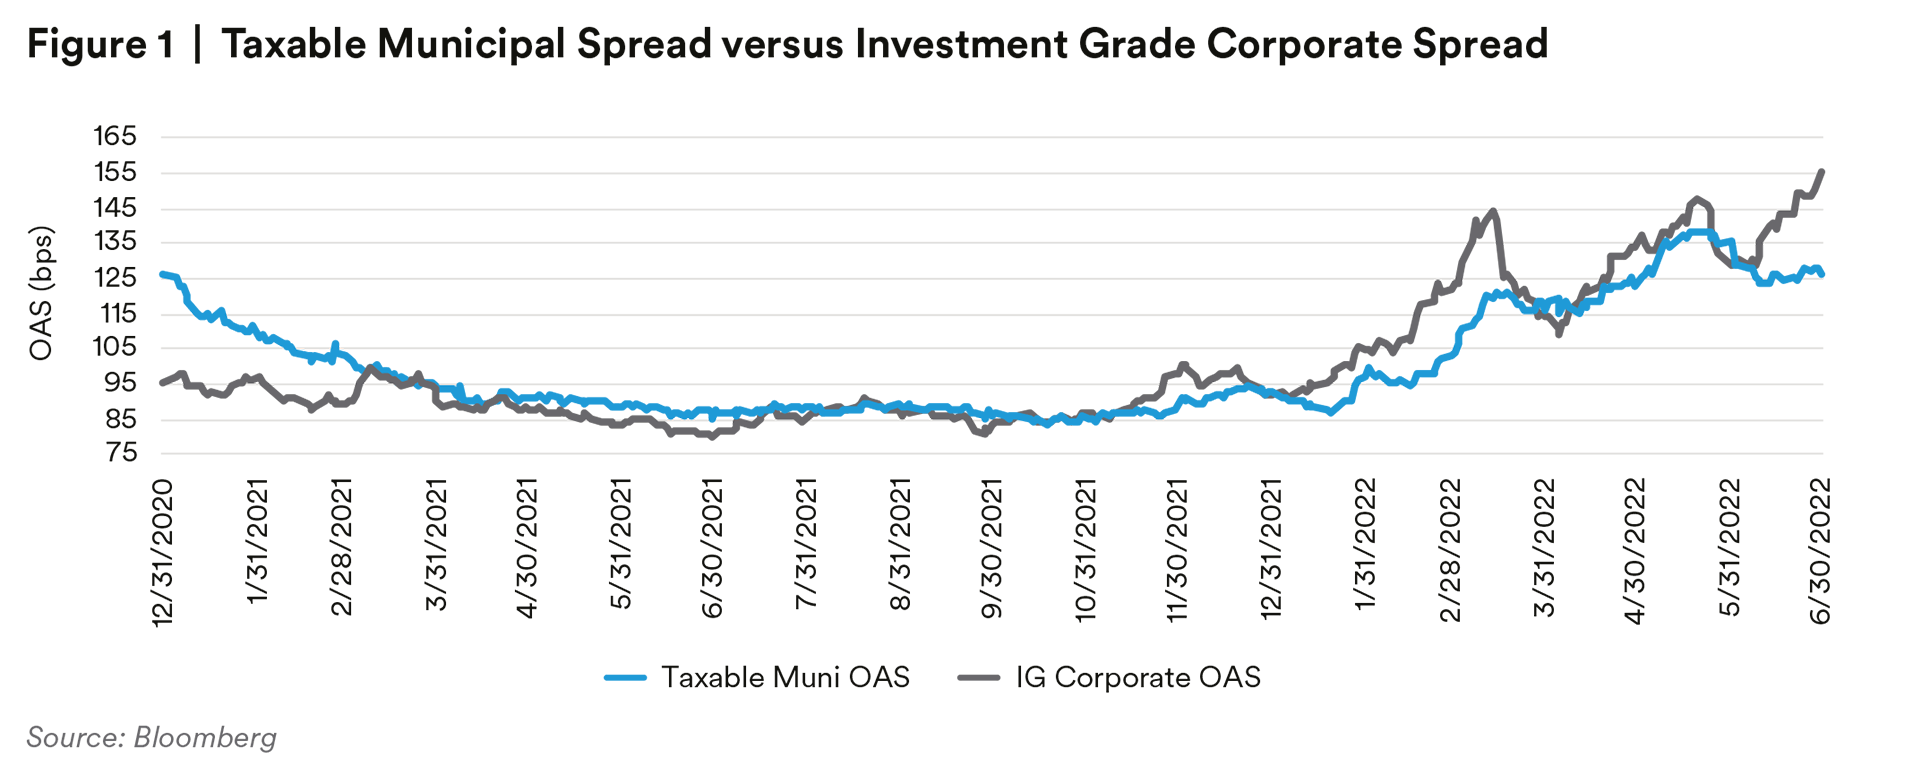
- Consistent with historical observations, Taxable Municipal spreads outperformed Investment Grade Corporates in a volatile “risk off” period. As the market narrative shifted toward the increasing probability of a recession engineered by aggressive policy tightening, the OAS on the Investment Grade Corporate Index surged from a low of 109 basis points on April 5th to 149 basis points on May 20th – a 40 basis point move in just a few weeks. Over the same time period, the spread widening in Taxable Municipals was notably less severe, at 28 basis points.2
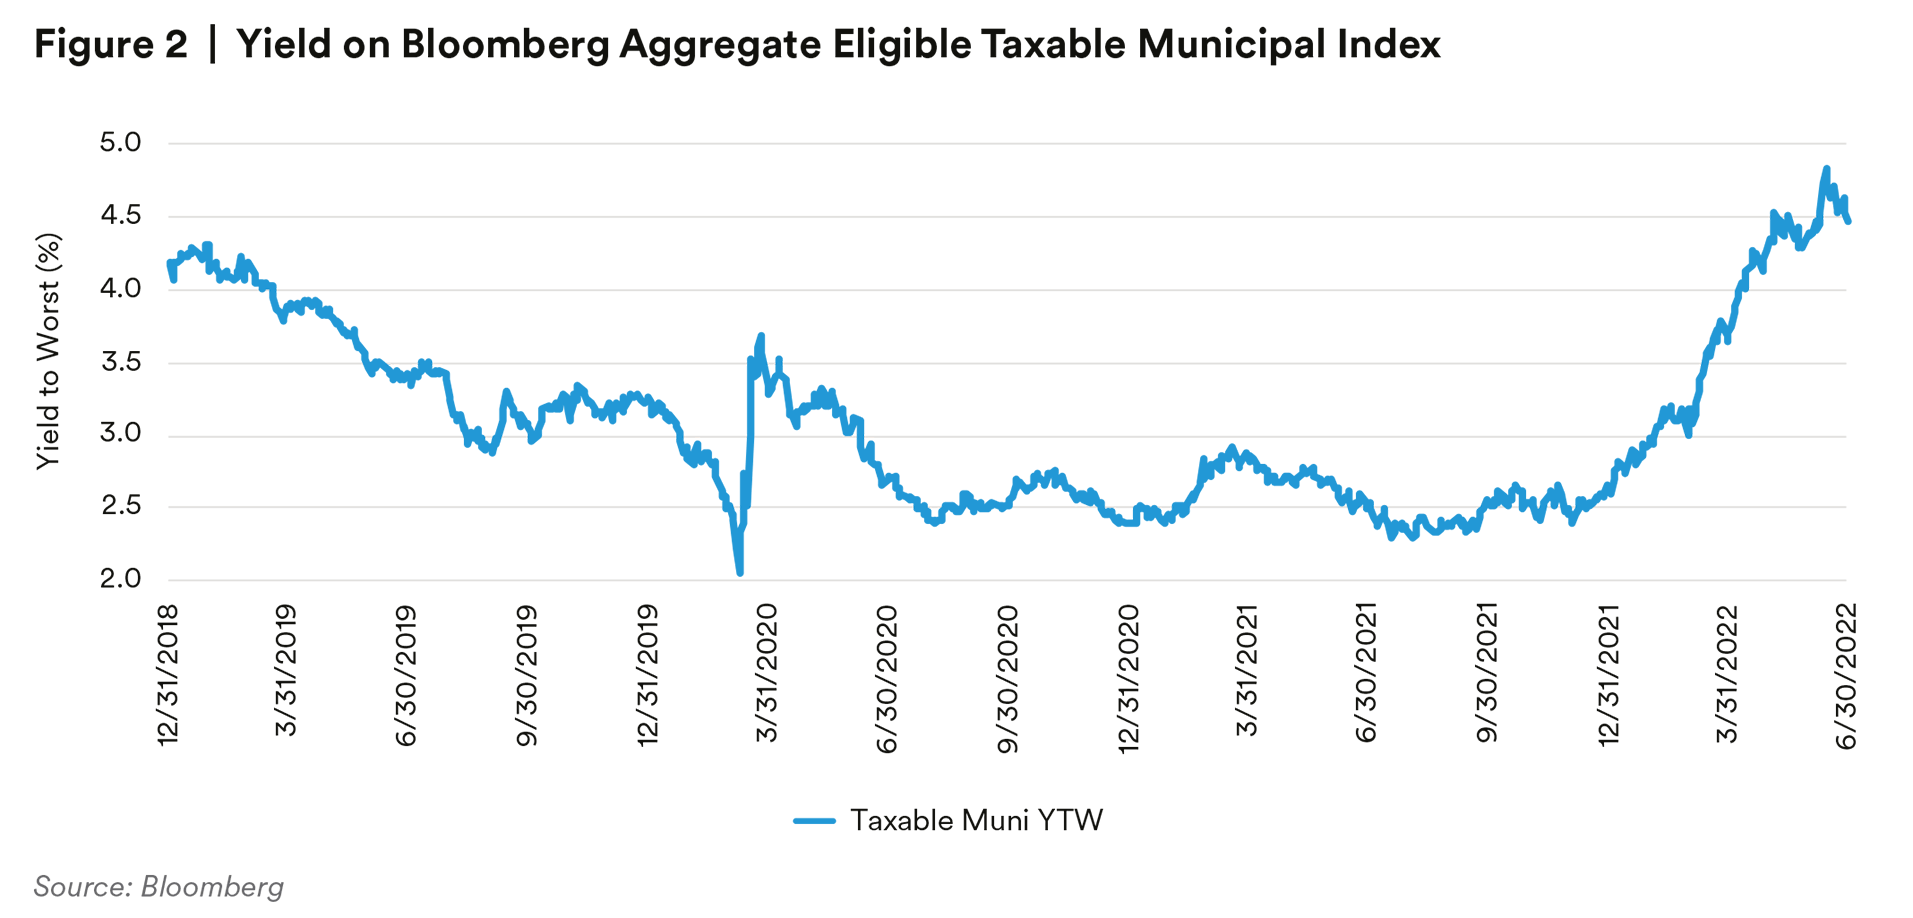
The 128 basis point move higher in the 30-year Treasury was by far the largest contributing factor to the -13.97% year-to-date total return for the Bloomberg Taxable Municipal Index. While the adjustment has been painful, the silver lining in the large negative returns is the significant repricing of Taxable Municipals yields. The yield-to-worst of the Bloomberg Aggregate-Eligible Taxable Municipal Index bottomed at a paltry 2.29% in August 2021.3 By June 30, 2022, the index yield had almost doubled to 4.46% with no material change in the credit composition of the index. In our view, this partially explains why Taxable Municipal spreads have been relatively resilient: higher yields have supported demand for high quality longer duration assets as expectations of weaker growth favor up-in-quality positioning, and as the curve continues to flatten or invert. We expect this dynamic to continue playing out through the rest of the year, particularly as corporate profits start to roll over and jobless claims trend higher.
One challenge for investors looking to participate in the Taxable Municipal market has been the sharp decline in new issuance compared to 2021. Year-to-date issuance of Taxable Municipals through June 30th totals $40.8 billion (including bonds issued by municipal issuers with corporate CUSIPs) – a 36% decline year-over-year.4 The primary culprit for the decline in issuance is higher rates, which undermine the economics of refunding transactions that had been a significant source of taxable new issue supply since tax-exempt advanced refundings were eliminated in 2018.
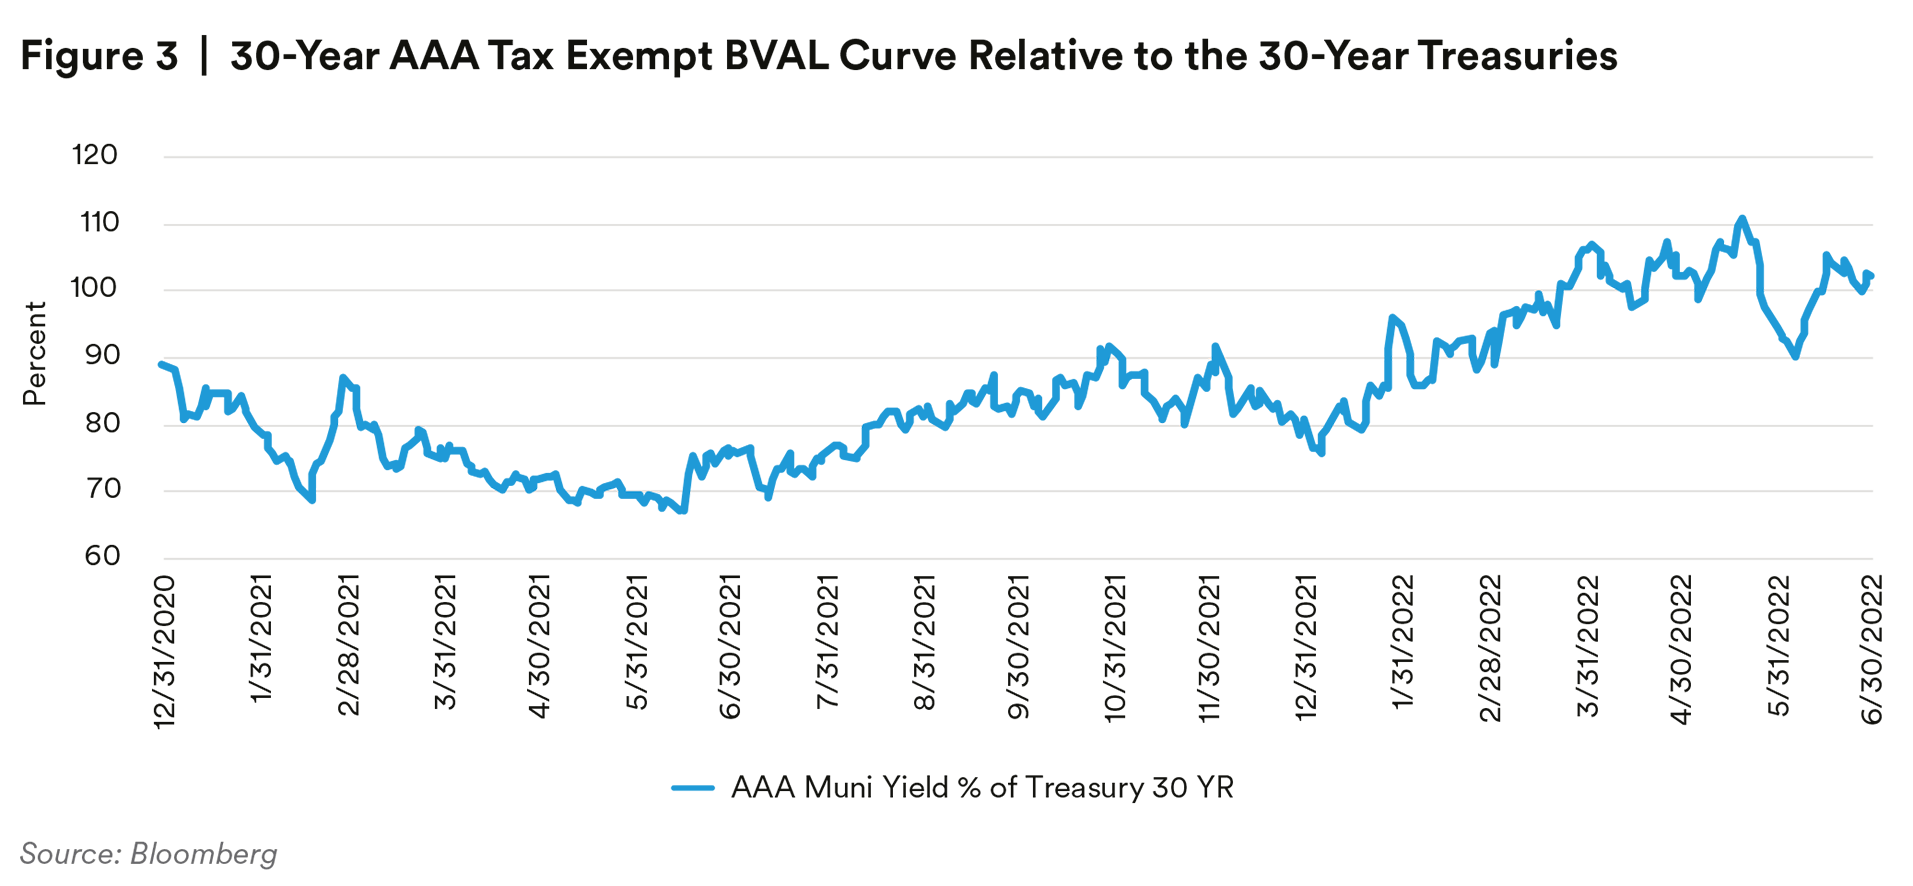
With more limited Taxable Municipal supply, a U.S. investor would be well served to keep an eye on the tax-exempt market. This overwhelmingly retail market offered little value for institutional investors in 2021, with abysmal yields and valuations at historical tights. However, the sharp rise in rates has led to record outflows from tax-exempt funds, which in turn has forced a severe adjustment in valuations. At times in the second quarter, tax-exempt yields became so dislocated that they appeared very compelling even to corporate taxpayers subject to much lower tax rates. A measure of relative value that we follow closely, the ratio of the 30-year AAA tax-exempt curve to 30-year U.S. Treasuries, surged from 81% at the beginning of the year to 111% in May. This ratio hit a low of 67% in 2021.5 At these times of dislocation when ratios spike to well over 100%, certain tax-exempt securities can offer (and have offered) a substantial yield pickup of 100 basis points or more on a taxable-equivalent basis relative to taxable municipal bonds from the same issuer. In these circumstances, we believe that allocations to tax-exempts can be highly advantageous in institutional portfolios subject to corporate tax rates.
From a credit perspective, we see that municipals are holding in very well and do not expect the trend to change materially. In the second quarter, Fitch Ratings upgraded 33 US public finance ratings and downgraded 12; a 2.75X ratio of upgrades to downgrades. We reiterate our call from last quarter that the municipal market is likely at peak credit quality for the cycle: it’s probably not getting much better, but we also do not expect it to get significantly worse. If a recession is indeed around the corner, we believe municipal issuers would be heading into it from a position of strength. The decline in the equity market will pressure tax revenues for state governments going forward, which means that the large budget surpluses of the last fiscal year are unlikely to be repeated. However, by and large, municipal issuers including states and essential service providers have the inherent pricing power (or the taxing authority) to navigate turbulent waters.
Looking forward, we are cautious on Taxable Municipal spreads heading into the third quarter. As of June 30th, the OAS on the Agg-Eligible Taxable Municipal Index was 13 basis points lower than the year-to-date peak of 140 basis points set on May 18th. Conversely, the OAS on the IG Corporate Index was 155 basis points, or 6 basis points wider than the YTD peak.6 The direction of traffic for the Taxable Municipal Index seems at odds with the path of spreads in other markets. The magnitude of the divergence in spreads between Taxable Municipals and Investment Grade Corporates adds to our cautious near-term outlook. On June 30th, the OAS on the Taxable Municipal Index was 28 basis points tighter than the OAS on the Investment Grade Corporate Index. By comparison, over the last three years the Taxable Municipal Index has traded 8 basis points wider on average than the Investment Grade Corporate Index, which difference we attribute primarily to differences in size, liquidity, and structure (i.e. optionality) between the two markets. Whatever the cause, the current spread relationship is 36 basis points out of line with the long-term average, which is the largest spread deviation between the two indexes since April 2020.7 We believe that some amount of mean reversion is likely in the third quarter, although not necessarily all the way back to the long-term average of 8 basis points. We identify a few factors that should be supportive of Taxable Municipal spreads through year end:
- The AA average rating of the Taxable Municipal Index is considerably higher than the A-/BBB+ average rating of the IG Corporate Index.8 The preference for high quality is a rational response in an environment where the probability of recession over the next 12 months has been steadily rising.
- Historically the Taxable Municipal Index widens less than the IG Corporate Index in times of acute market stress. For example, at the height of the COVID crisis in 2020, the IG Corporate Index widened by 251 basis points from the end of February to the peak in March, while the Taxable Municipal Index widened by 151 basis points over the same period.9
- From a credit perspective, historical rating transition data from S&P shows that the downgrade frequency for Municipals in periods of recession is far lower than for IG Corporates. Following the 2008-09 recession, S&P’s ratio of upgrades to downgrades for US Municipals dropped to a low of 0.69x in the fourth quarter of 2011 (compared to the 5-year average of 3.86x). In the corporate market, this ratio dropped to a low of just 0.08x (compared to the 5-year average of 0.57x).10
- New issue supply of Taxable Municipals is down 36% through June 30, 2022, compared to the same period in 2021. This is largely due to the evaporation of refunding transactions that accounted for a substantial share of new issuance in 2020 and 2021. Absent a material increase in Taxable Municipal issuance, there are few forces at play to drive spreads wider.
These factors would lead us to add more Taxable Municipal risk on weakness in the second half, as the OAS differential between the Taxable Municipal Index and the Investment Grade Corporate Index gets closer to the historical average. Our view is that a recession is likely mid-to-late 2023. For investors with longer duration needs, we like the higher credit quality and lower volatility of Taxable Municipals in an environment with increasing macroeconomic risks.
Endnotes
1 Source: Bloomberg
2 Source: Bloomberg
3 For reference, the index has a duration of 10.4 years and an average rating of AA as of June 30/2022.
4 Source: Bloomberg
5 Source: Bloomberg
6 Source: Bloomberg
7 Source: Bloomberg
8 Source: Blackrock Aladdin
9 Source: Bloomberg
10 Source: Standard & Poor’s
Disclosure
This material is intended solely for Institutional Investors, Qualified Investors and Professional Investors. This analysis is not intended for distribution with Retail Investors.
This document has been prepared by MetLife Investment Management (“MIM”)1 solely for informational purposes and does not constitute a recommendation regarding any investments or the provision of any investment advice, or constitute or form part of any advertisement of, offer for sale or subscription of, solicitation or invitation of any offer or recommendation to purchase or subscribe for any securities or investment advisory services. The views expressed herein are solely those of MIM and do not necessarily reflect, nor are they necessarily consistent with, the views held by, or the forecasts utilized by, the entities within the MetLife enterprise that provide insurance products, annuities and employee benefit programs. The information and opinions presented or contained in this document are provided as the date it was written. It should be understood that subsequent developments may materially affect the information contained in this document, which none of MIM, its affiliates, advisors or representatives are under an obligation to update, revise or affirm. It is not MIM’s intention to provide, and you may not rely on this document as providing, a recommendation with respect to any particular investment strategy or investment. Affiliates of MIM may perform services for, solicit business from, hold long or short positions in, or otherwise be interested in the investments (including derivatives) of any company mentioned herein. This document may contain forward-looking statements, as well as predictions, projections and forecasts of the economy or economic trends of the markets, which are not necessarily indicative of the future. Any or all forward-looking statements, as well as those included in any other material discussed at the presentation, may turn out to be wrong.
All investments involve risks including the potential for loss of principle and past performance does not guarantee similar future results. More specifically, investments in private structured credit involve significant risks, which include certain consequences as a result of, among other factors, borrower defaults and, fluctuations in interest rates. When originating a loan, a lender will rely significantly upon representations made by the borrower. There can be no assurance that such representations are accurate or complete, and any misrepresentation or omission may adversely affect the valuation of the collateral underlying the loan, or may adversely affect the ability of the lender to perfect or foreclose on a lien on the collateral securing the loan, or may result in liability of the lender to a subsequent purchaser of the loan. Private debt instruments have a limited number of potential purchasers and sellers. This factor may have the effect of limiting the availability of these investments for purchase and may also limit the ability to sell such investments at their fair market value in response to changes in the economy or the financial market. The investments and strategies discussed herein may not be suitable for all investors. The material is not intended to provide, and should not be relied on for, accounting, legal or tax advice, or investment recommendations. You should consult your tax or legal adviser about the issues discussed herein. The investments discussed may fluctuate in price or value. Investors may get back less than they invested.
In the U.S. this document is communicated by MetLife Investment Management, LLC (MIM, LLC), a U.S. Securities Exchange Commission registered investment adviser. MIM, LLC is a subsidiary of MetLife, Inc. and part of MetLife Investment Management. Registration with the SEC does not imply a certain level of skill or that the SEC has endorsed the investment advisor.
This document is being distributed by MetLife Investment Management Limited (“MIML”), authorised and regulated by the UK Financial Conduct Authority (FCA reference number 623761), registered address 1 Angel Lane 8th Floor London EC4R 3AB United Kingdom. This document is approved by MIML as a financial promotion for distribution in the UK. This document is only intended for, and may only be distributed to, investors in the UK and EEA who qualify as a “professional client” as defined under the Markets in Financial Instruments Directive (2014/65/EU), as implemented in the relevant EEA jurisdiction, and the retained EU law version of the same in the UK.
MIMEL: For investors in the EEA, this document is being distributed by MetLife Investment Management Europe Limited (“MIMEL”), authorised and regulated by the Central Bank of Ireland (registered number: C451684), registered address 20 on Hatch, Lower Hatch Street, Dublin 2, Ireland. This document is approved by MIMEL as marketing communications for the purposes of the EU Directive 2014/65/EU on markets in financial instruments (“MiFID II”). Where MIMEL does not have an applicable cross-border licence, this document is only intended for, and may only be distributed on request to, investors in the EEA who qualify as a “professional client” as defined under MiFID II, as implemented in the relevant EEA jurisdiction.
For investors in the Middle East: This document is directed at and intended for institutional investors (as such term is defined in the various jurisdictions) only. The recipient of this document acknowledges that (1) no regulator or governmental authority in the Gulf Cooperation Council (“GCC”) or the Middle East has reviewed or approved this document or the substance contained within it, (2) this document is not for general circulation in the GCC or the Middle East and is provided on a confidential basis to the addressee only, (3) MetLife Investment Management is not licensed or regulated by any regulatory or governmental authority in the Middle East or the GCC, and (4) this document does not constitute or form part of any investment advice or solicitation of investment products in the GCC or Middle East or in any jurisdiction in which the provision of investment advice or any solicitation would be unlawful under the securities laws of such jurisdiction (and this document is therefore not construed as such).
For investors in Japan: This document is being distributed by MetLife Asset Management Corp. (Japan) (“MAM”), 1-3 Kioicho, Chiyodaku, Tokyo 102-0094, Tokyo Garden Terrace KioiCho Kioi Tower 25F, a registered Financial Instruments Business Operator (“FIBO”) under the registration entry Director General of the Kanto Local Finance Bureau (FIBO) No. 2414. For Investors in Hong Kong S.A.R.: This document is being issued by MetLife Investments Asia Limited (“MIAL”), a part of MIM, and it has not been reviewed by the Securities and Futures Commission of Hong Kong (“SFC”).
For investors in Australia: This information is distributed by MIM LLC and is intended for “wholesale clients” as defined in section 761G of the Corporations Act 2001 (Cth) (the Act). MIM LLC exempt from the requirement to hold an Australian financial services license under the Act in respect of the financial services it provides to Australian clients. MIM LLC is regulated by the SEC under US law, which is different from Australian law.
1 MetLife Investment Management (“MIM”) is MetLife, Inc.’s institutional management business and the marketing name for subsidiaries of MetLife that provide investment management services to MetLife’s general account, separate accounts and/or unaffiliated/third party investors, including: Metropolitan Life Insurance Company, MetLife Investment Management, LLC, MetLife Investment Management Limited, MetLife Investments Limited, MetLife Investments Asia Limited, MetLife Latin America Asesorias e Inversiones Limitada, MetLife Asset Management Corp. (Japan), MIM I LLC and MetLife Investment Management Europe Limited.
Unless otherwise noted, none of the authors of the articles on this page are regulated in Ireland.