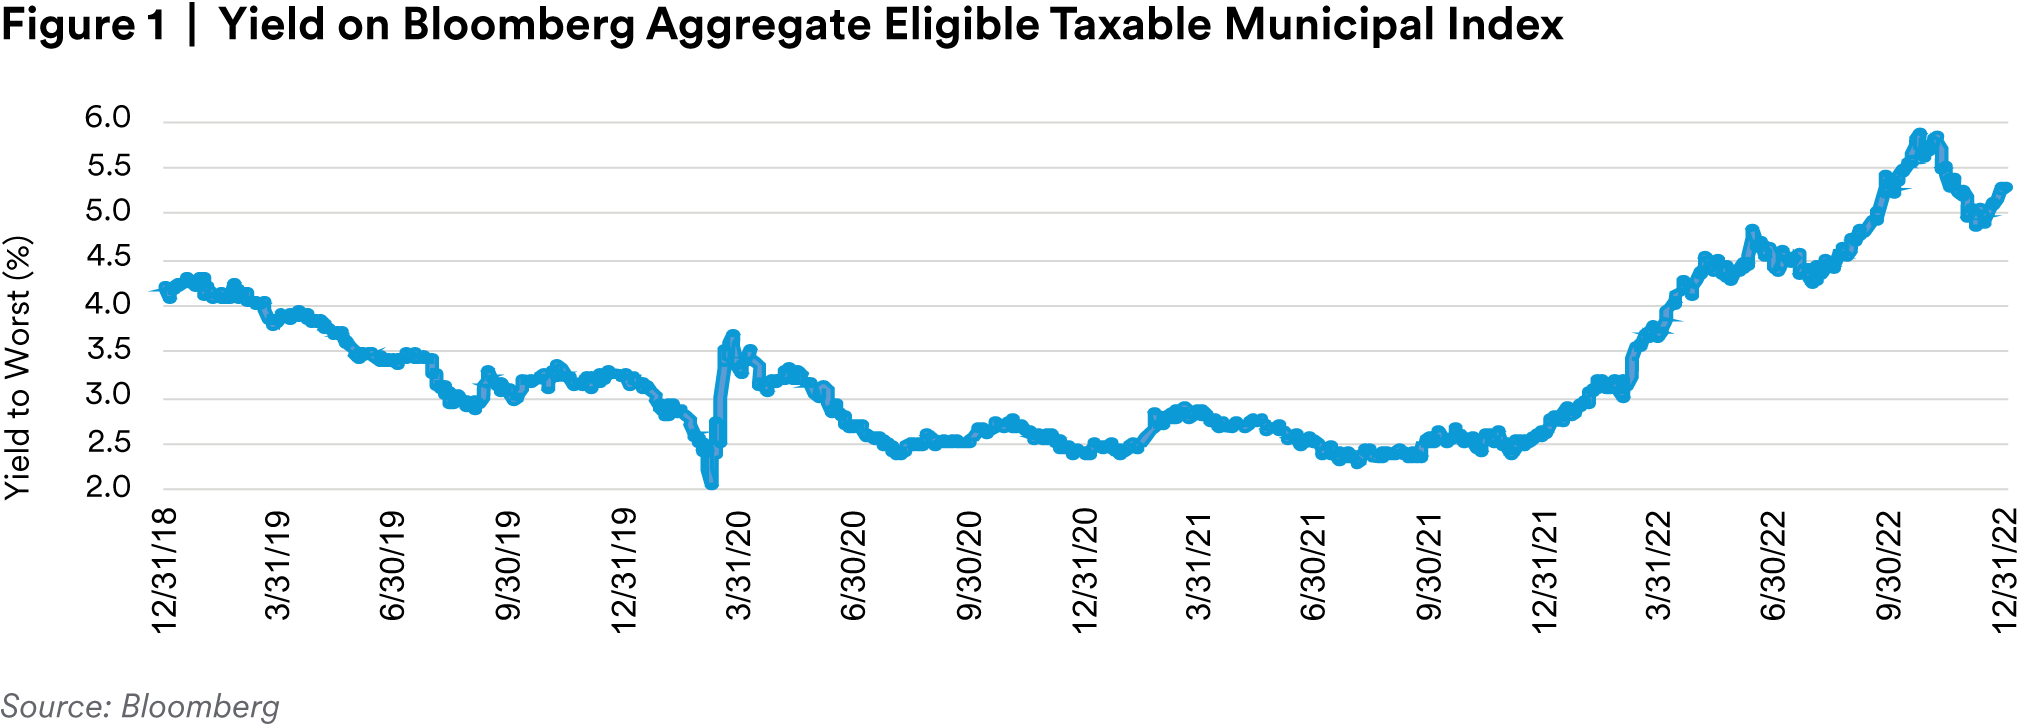
The fourth quarter continued to bring extreme volatility in rates as markets digested each new macro data point to divine the future path of Fed policy. The 30-year Treasury surged 60 basis points higher in the first three weeks of October, then sharply reversed course after the October CPI report, collapsing 95 basis points to the December low of 3.43%. The net increase for the quarter was only 18 basis points but the path to get there was far from direct. For the year as a whole the intra-month volatility seems like noise in context of the sharp upward climb of the 30-year Treasury from 1.90% on December 31, 2021 to 3.96% on December 30, 2022. Taxable Municipal spreads largely tracked rates in terms of both direction and magnitude. As rates climbed higher, investors demanded ever wider spreads to catch the proverbial falling knife of a long duration asset. However, as conviction in the narrative of peak rates increased, the appetite for high quality long duration assets at the highest yields in over a decade surged. The OAS on the Bloomberg Aggregate Eligible Taxable Municipal index peaked at 147 basis points on October 31st then rallied sharply with rates through the end of the year to close at 128 basis points – 11 basis points tighter for the quarter.2
The decline in rates from the peaks in October also set the stage for a rally in tax-exempts, which until then had been hammered by the largest outflow cycle in history. Fund flows historically have a strong negative correlation to the direction of rates as well as the magnitude of change. Accordingly, the inflection in rates raised expectations for a normalization in fund flows that would boost valuations. The other main driver was yield. On October 31st, the yield on the AAA BVAL tax-exempt curve in 30 years was 4.11%. That translates to a taxable-equivalent yield of almost 9% for individuals in high tax brackets. That’s 9% for a AAA asset. Not surprisingly, at the first sign that the pain of ever rising rates may have stopped, valuations for tax-exempt securities snapped sharply higher. For example, the ratio of the BVAL AAA tax-exempt curve to Treasuries in 10 years plummeted from 85% to 68% in the quarter – well below the 5-year average of 88%. This translated to a quarterly return of 4.10% for the broad Bloomberg Municipal Bond index and a return of 3.05% for the Bloomberg 5 year (4-6) Municipal Bond index. 3

In our view, tax-exempt valuations now look extremely unattractive to investors subject to corporate tax rates. When the retail buyer is buying, it simply is not a fair fight for the corporate investor. Prices are being set by individual investors with much higher combined federal and state tax rates, and thus with a much larger benefit from the tax exemption. The longer end of the tax-exempt curve has lagged the magnitude of the rally in the more retail-focused 10-year part of the curve. This is because the primary buyers of long tax-exempts were either still experiencing outflows (mutual funds), or they got priced out by frothier valuations (insurance companies, banks, cross-over buyers). The 30-year ratio fell from 104% to 91%, ending the quarter modestly below the historical average of 98%.4 At these levels, while not as rich as tax-exempts inside 10 years, we think the window of opportunity in long tax-exempts has largely closed for corporate investors, as taxable-equivalent yields no longer look nearly as compelling relative to taxable alternatives.
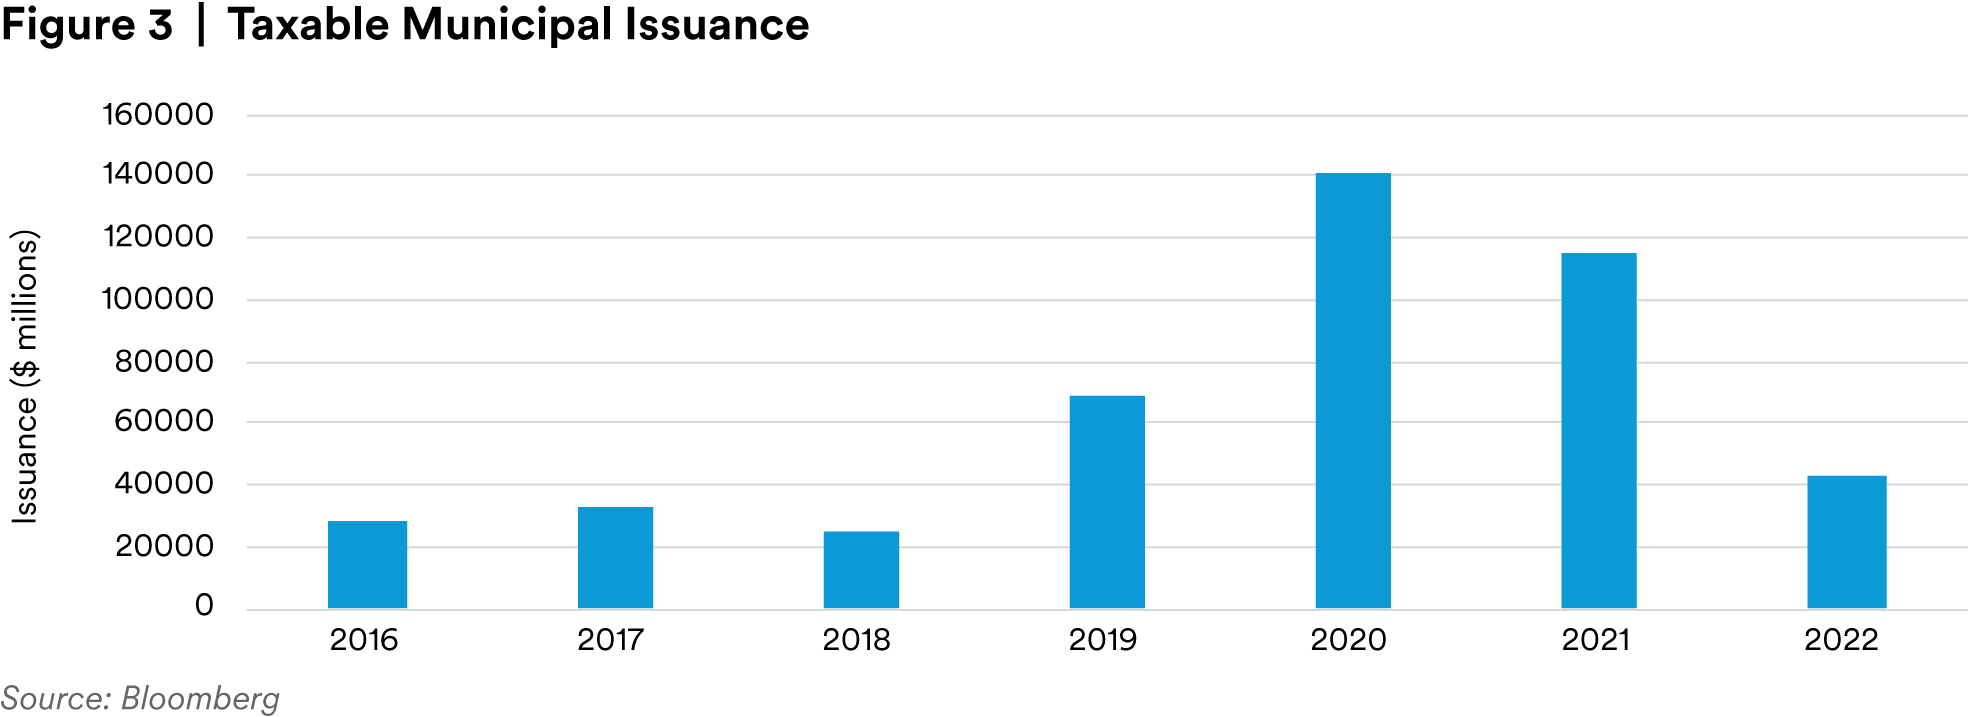
Total Municipal issuance totaled $380 billion in 2022, which was down 21% compared to 2021. Disappointingly, Taxable Municipals were responsible for the bulk of the decline with a total of only $57.8 billion issued including $10.0 billion of Taxable Municipals with corporate CUSIPs. Year-over-year, Taxable new issuance declined by over 50% as significantly higher rates eliminated the opportunity to refund outstanding tax-exempt bonds with new taxable bonds.5 Taxable advance refundings had represented a large share of Taxable Municipal issuance since Tax Reform. With a sharp rally in tax-exempts that should continue as fund flows stabilize or turn positive, we expect that municipal issuers will gravitate to the tax-exempt market to lock in the lowest cost of funds on new issues. Until and unless longer rates decline meaningfully, potential advance refunding transactions with taxable bonds are likely to remain out of the money for issuers and as such, the supply of these transactions is likely to remain depressed in the near term. Our estimate for Taxable Municipal issuance in 2023 is $60 billion – similar to 2022 but well below the $179.5 billion in 2020 and the $139 billion in 2021.
We expect 2023 to be a much better year for Municipal returns. Admittedly, the bar was set exceedingly low in 2022. Our base case assumes that inflation continues to trend lower toward the Fed’s 2% target and that the Fed hikes rates early then stays on hold through the rest of the year. We think the lagged and variable impact of 425 basis points (and counting) in rate hikes will start to crack the labor market and tip the economy tips into recession in the second half of the year. This is not necessarily bad for Municipals, a high quality asset class that typically performs well in weaker macro environments.
For Taxables, we expect wider spreads by the end of 2023. The starting point for valuations is not particularly attractive at an OAS of 128 basis points on the Bloomberg Aggregate Eligible Taxable Municipal index.6 This is only three basis points wider than the average over the last five years.7 We think Taxable Municipals will take cues from the larger and more liquid investment grade corporate market when the coming recession presents a more clear and present danger. Those cues will be in the form of wider spreads. However, we think the move wider in spreads will likely be capped at 145 basis points – about 20 basis points from current levels and slightly below the recent peak of 147 basis in October. We expect Taxable Municipal spreads to hold in considerably better than investment grade corporates as the market starts to price in a recession for three primary reasons: the higher credit quality of the Taxable Municipal index (the average rating the broad Bloomberg Taxable Municipal index as of December 30th is Aa3/AA)8; favorable technicals based on our estimate of only $60 billion of Taxable supply in 2023; and very solid municipal fundamentals heading into 2023. This will translate to significantly better excess returns for the Taxable Municipal index relative to the Investment Grade Corporate index, in our view.
In order to achieve positive returns, we expect that wider spreads will be offset by lower rates. We see the market narrative shifting from one of a soft landing and rate cuts in 2023 (Fed Funds Futures are pricing in almost two rate cuts in the second half of 2023)9 to one that includes a recession and a Fed on hold as sticky inflation pressures push out the timeline to achieve the Fed’s 2% target. In that scenario, we envision significant further inversion in the 2s/10s curve as short rates unwind cuts currently priced into Fed Fund Futures while the longer end of the curve gets pushed lower by a flight to safety and expectations of rate cuts in the future. Another factor supporting returns will be the carry from an index yield of 5.29% as of December 30th, 2022.10 By comparison, the starting point for yields was only 2.60% in 2021 and 2.39% in 2020.
Volatility will likely continue to be part of the script in 2023, which should create plenty of opportunities and better entry points for Municipals. One possible catalyst for volatility is resolution of the debate on recession and rate cuts. The market right now seems to be pricing the average of the two outcomes – but it has to be one or the other. There will be either a soft landing or a recession. The Fed will start cutting rates this summer or it won’t. If we are correct that a recession is likely in 2023 but rate cuts are not, markets will reprice wider and this is likely to be noisy. Another potential catalyst is the possibility that something breaks (the unknown unknown) under the weight of massive rate hikes in such a short period of time. We hesitate to guess precisely what could break in 2023 but we do find ourselves asking, what are the chances that something doesn’t break? Said differently, how likely is it that the outcome of a lightning quick transition from extreme accommodation to extreme tightening is something that resembles normal? We think not likely – keep some dry powder for opportunities in 2023.
Endnotes
1 Bloomberg
2 Bloomberg
3 Bloomberg
4 Bloomberg
5 Bloomberg
6 Bloomberg
7 Bloomberg
8 Bloomberg
9 Bloomberg
10 Bloomberg
Disclaimer
This material is intended solely for Institutional Investors, Qualified Investors and Professional Investors. This analysis is not intended for distribution with Retail Investors. This document has been prepared by MetLife Investment Management (“MIM”) solely for informational purposes and does not constitute a recommendation regarding any investments or the provision of any investment advice, or constitute or form part of any advertisement of, offer for sale or subscription of, solicitation or invitation of any offer or recommendation to purchase or subscribe for any securities or investment advisory services. The views expressed herein are solely those of MIM and do not necessarily reflect, nor are they necessarily consistent with, the views held by, or the forecasts utilized by, the entities within the MetLife enterprise that provide insurance products, annuities and employee benefit programs. The information and opinions presented or contained in this document are provided as of the date it was written. It should be understood that subsequent developments may materially affect the information contained in this document, which none of MIM, its affiliates, advisors or representatives are under an obligation to update, revise or affirm. It is not MIM’s intention to provide, and you may not rely on this document as providing, a recommendation with respect to any particular investment strategy or investment. Affiliates of MIM may perform services for, solicit business from, hold long or short positions in, or otherwise be interested in the investments (including derivatives) of any company mentioned herein. This document may contain forward-looking statements, as well as predictions, projections and forecasts of the economy or economic trends of the markets, which are not necessarily indicative of the future. Any or all forward-looking statements, as well as those included in any other material discussed at the presentation, may turn out to be wrong.
All investments involve risks including the potential for loss of principle and past performance does not guarantee similar future results. Particular risks of investing in emerging market securities include: smaller market capitalization of securities markets; potential for significant price volatility: potential restrictions on foreign investment; political instability; and possible seizure of a company’s assets.
In the U.S. this document is communicated by MetLife Investment Management, LLC (MIM, LLC), a U.S. Securities Exchange Commission registered investment adviser. MIM, LLC is a subsidiary of MetLife, Inc. and part of MetLife Investment Management. Registration with the SEC does not imply a certain level of skill or that the SEC has endorsed the investment advisor.
This document is being distributed by MetLife Investment Management Limited (“MIML”), authorised and regulated by the UK Financial Conduct Authority (FCA reference number 623761), registered address 1 Angel Lane, 8th Floor, London, EC4R 3AB, United Kingdom. This document is approved by MIML as a financial promotion for distribution in the UK. This document is only intended for, and may only be distributed to, investors in the UK and EEA who qualify as a “professional client” as defined under the Markets in Financial Instruments Directive (2014/65/EU), as implemented in the relevant EEA jurisdiction, and the retained EU law version of the same in the UK.
For investors in the Middle East: This document is directed at and intended for institutional investors (as such term is defined in the various jurisdictions) only. The recipient of this document acknowledges that (1) no regulator or governmental authority in the Gulf Cooperation Council (“GCC”) or the Middle East has reviewed or approved this document or the substance contained within it, (2) this document is not for general circulation in the GCC or the Middle East and is provided on a confidential basis to the addressee only, (3) MetLife Investment Management is not licensed or regulated by any regulatory or governmental authority in the Middle East or the GCC, and (4) this document does not constitute or form part of any investment advice or solicitation of investment products in the GCC or Middle East or in any jurisdiction in which the provision of investment advice or any solicitation would be unlawful under the securities laws of such jurisdiction (and this document is therefore not construed as such).
For investors in Japan: This document is being distributed by MetLife Asset Management Corp. (Japan) (“MAM”), 1-3 Kioicho, Chiyodaku, Tokyo 102-0094, Tokyo Garden Terrace KioiCho Kioi Tower 25F, a registered Financial Instruments Business Operator (“FIBO”) under the registration entry Director General of the Kanto Local Finance Bureau (FIBO) No. 2414.
For Investors in Hong Kong S.A.R.: This document is being issued by MetLife Investments Asia Limited (“MIAL”), a part of MIM, and it has not been reviewed by the Securities and Futures Commission of Hong Kong (“SFC”). MIAL is licensed by the Securities and Futures Commission for Type 1 (dealing in securities), Type 4 (advising on securities) and Type 9 (asset management) regulated activities.
For investors in Australia: This information is distributed by MIM LLC and is intended for “wholesale clients” as defined in section 761G of the Corporations Act 2001 (Cth) (the Act). MIM LLC exempt from the requirement to hold an Australian financial services license under the Act in respect of the financial services it provides to Australian clients. MIM LLC is regulated by the SEC under US law, which is different from Australian law.
MIMEL: For investors in the EEA, this document is being distributed by MetLife Investment Management Europe Limited (“MIMEL”), authorised and regulated by the Central Bank of Ireland (registered number: C451684), registered address 20 on Hatch, Lower Hatch Street, Dublin 2, Ireland. This document is approved by MIMEL as marketing communications for the purposes of the EU Directive 2014/65/EU on markets in financial instruments (“MiFID II”). Where MIMEL does not have an applicable cross-border licence, this document is only intended for, and may only be distributed on request to, investors in the EEA who qualify as a “professional client” as defined under MiFID II, as implemented in the relevant EEA jurisdiction. Unless otherwise stated, none of the authors of the articles on these pages are regulated in Ireland.
1 MetLife Investment Management (“MIM”) is MetLife, Inc.’s institutional management business and the marketing name for subsidiaries of MetLife that provide investment management services to MetLife’s general account, separate accounts and/or unaffiliated/third party investors, including: Metropolitan Life Insurance Company, MetLife Investment Management, LLC, MetLife Investment Management Limited, MetLife Investments Limited, MetLife Investments Asia Limited, MetLife Latin America Asesorias e Inversiones Limitada, MetLife Asset Management Corp. (Japan), and MIM I LLC and MetLife Investment Management Europe Limited.