Kicking the Rate Hike Can?
Stickier than expected inflation and robust economic activity have delayed and diminished expectations for rate cuts in 2024. Markets are now pricing only 25 basis points of cuts for later in the year, down from the 150-200 bps in cuts that were priced in at the end of 2023.1 While economic data have been stronger than expected, persistent restrictive monetary policy could negatively impact the broader economy and remains a downside risk.
We believe that 25 basis points of cuts in the second half of this year is a reasonable base assumption and expect the U.S. Treasury 10 year—currently trading near 4.4%—will be locked in a tight range for the duration of 2024, hovering near 4.5%.
In our 2024 outlook published last quarter we were asking if spot market prices were at or past the trough. We have now seen enough transactions to conclude that commercial real estate prices are past the trough.
In addition to direct observation of transaction prices, our relative value benchmark (exhibit 1) also suggests that prices should be rising. The benchmark compares proprietary tracking of current CRE market pricing collected from MIM’s acquisitions teams to Baa bond yields + 200 basis points.
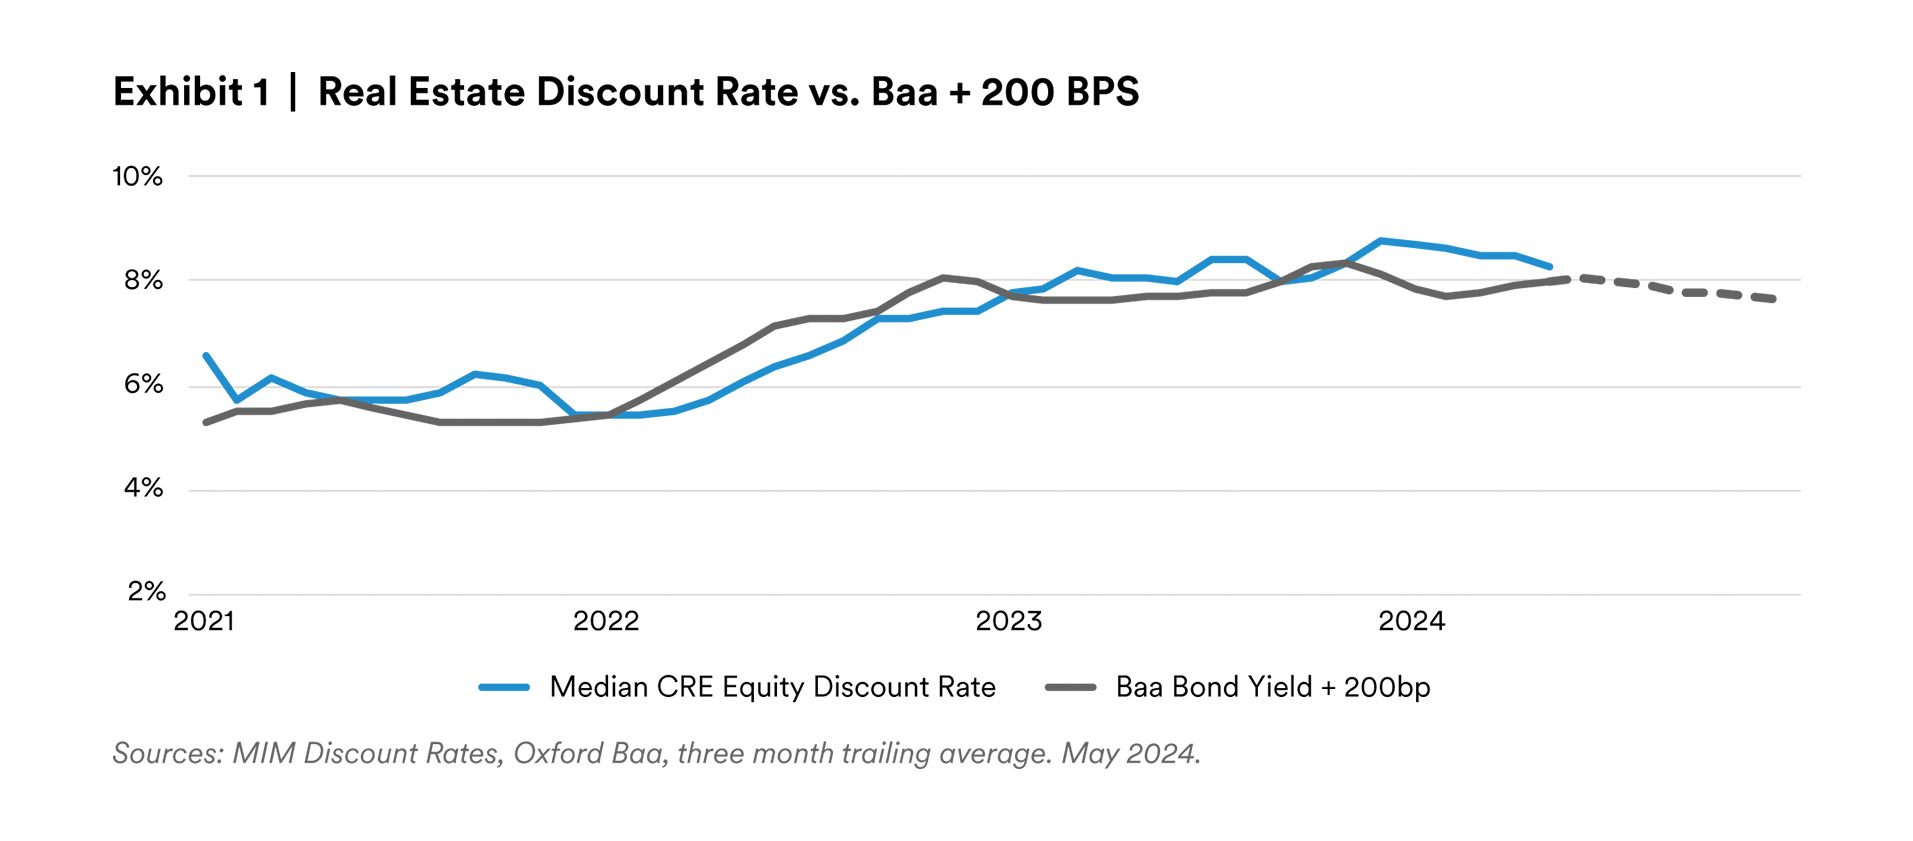
This dataset represents a 3-month trailing average through May and is generally capturing the recent increase in treasuries. There appears to be sufficient cushion between spot yields for equity real estate and bond yields to absorb the re-pricing of rate cuts without causing further deterioration in property values. In fact, this dataset suggests property prices may have even slightly over-corrected at the start of this year.
Although this dataset is not perfect, it serves as a valuable tool among many in MIM’s toolbox for evaluating real estate capital market conditions. We believe it is a helpful “north star” in a market where transaction volume, and thus transparency, is low. Based on this analysis, we would begin to re-think our call for the trough in real estate prices if the 10-year treasury rises above 5.0% and remains in that range for at least one quarter. The most likely scenario for an upside surprise in rates would be resurgent inflation, represented by several consecutive months of PCE inflation exceeding 5% on an annualized basis.
Real Estate Fundamentals on Stable Footing
Similar to the broader economy, trends in real estate fundamentals are generally positive. Possibly the most noteworthy trend since the start of 2024 has been some early bright spots for the office sector.
In our view, office sublease availability is an important leading indicator for general office vacancy trends. In exhibit 2, we observe that sublease vacancy leads general vacancy by roughly four quarters. At the start of this year, office sublease vacancy declined for the first time since the start of the pandemic.
This data warrants some “taking with a grain of salt”. Anecdotally, we have also observed a handful of firms removing sublease space from the market that they have been unable to lease, which would explain the reduction in sublease availability (a false positive). This dataset though has been an important and reliable indicator over the last 20 years, and one worth monitoring.
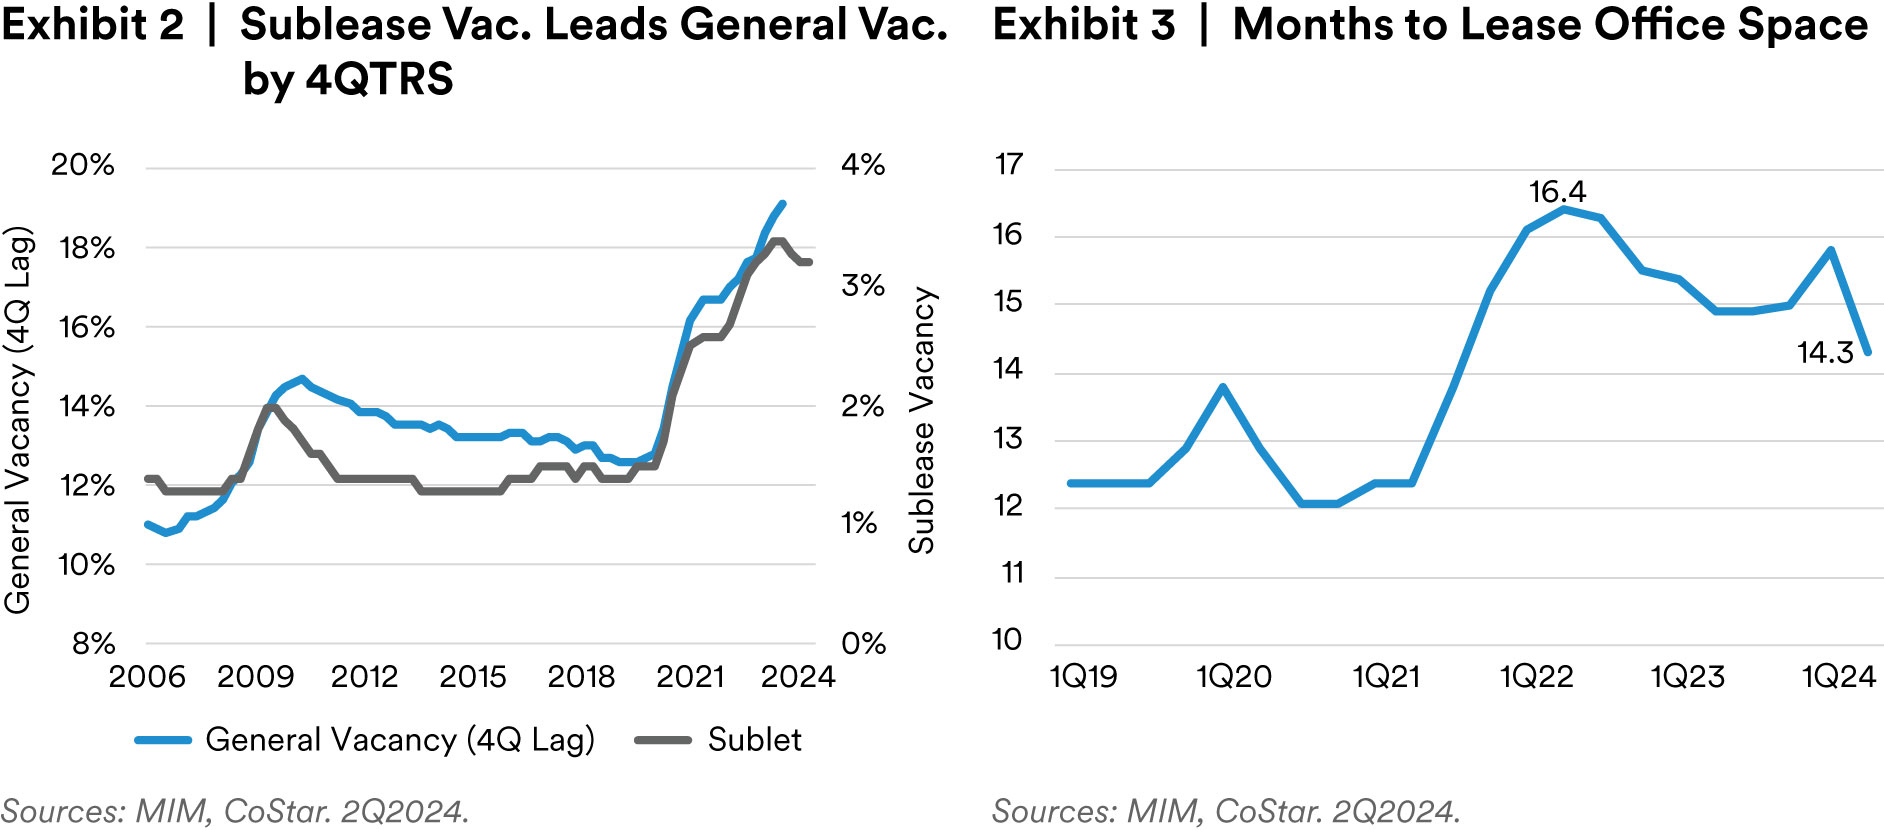
In addition to improving office sublease vacancy, the amount of time vacant office space is sitting on the market has begun to decline (exhibit 3). Taken together, we believe these trends imply that office vacancy will rise from 19.0% to 20.0% by the end of 2024, before beginning to decline next year.2
As we pointed out last quarter, the industrial and multifamily sectors are generally healthy, but are facing some pockets of supply risk. In the multifamily sector, markets like Austin, Nashville, and Charlotte will likely underperform this year as elevated deliveries dampen rent growth. At the same time markets with less favorable demographics like Chicago, New York, and Orange County are not facing supply pressures, and investors are benefiting from high occupancy levels and stronger rental growth.
Industrial has not been immune from elevated supply growth. In the first quarter of 2024, industrial vacancy rose 70 basis points to 7.8%.3 While this vacancy level remains below the historical average, performance divergences across markets have emerged, and are very much a function of supply barriers (exhibit 4).
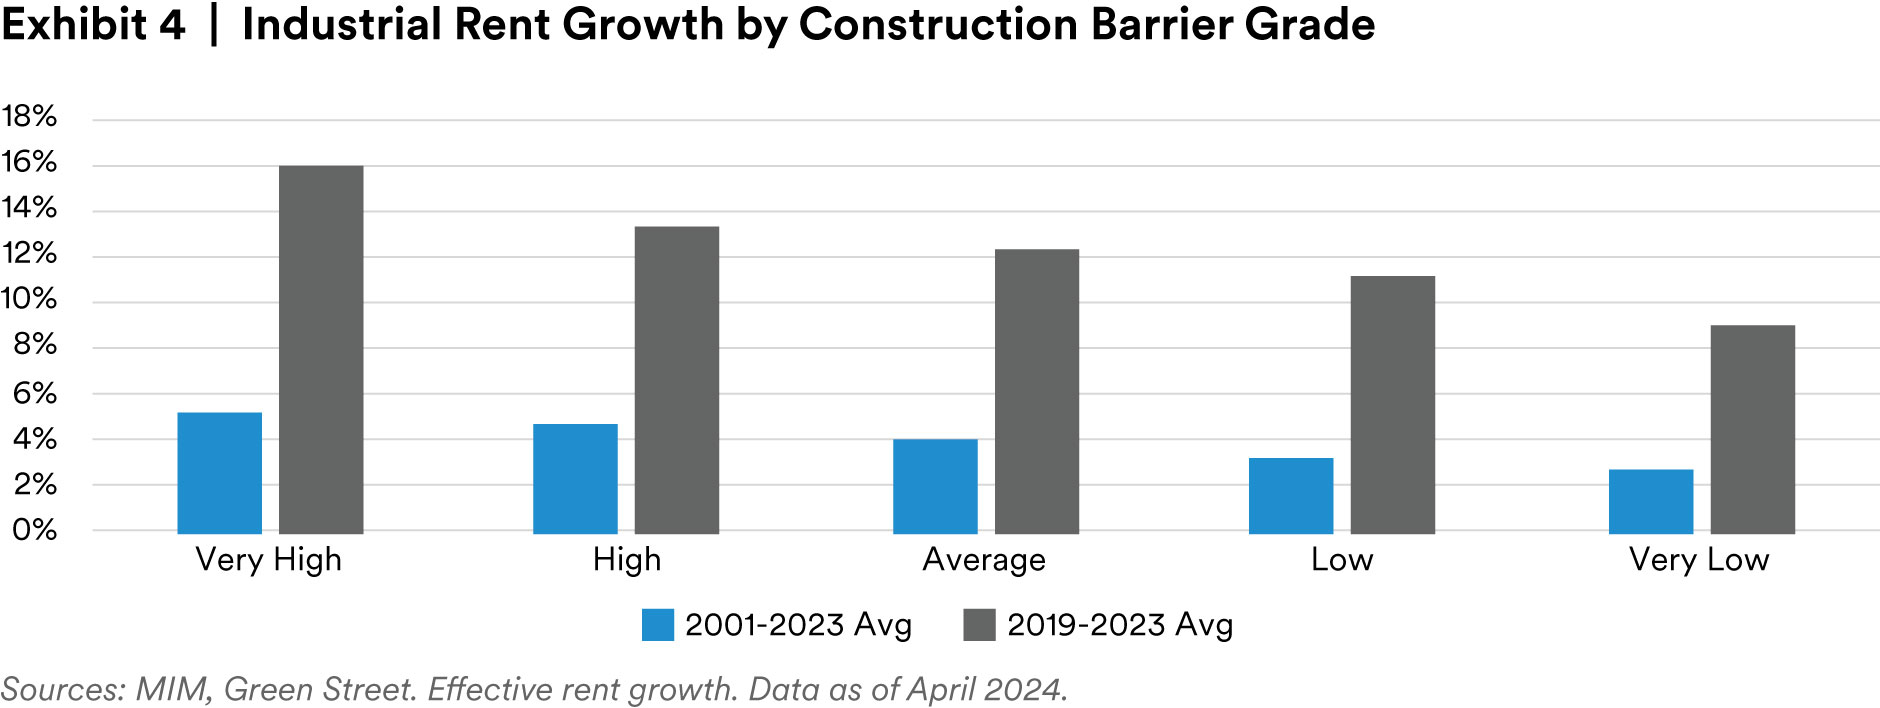
Markets like New York, Ft. Lauderdale, and Orange County, which have physical or legislative barriers to new supply, have been outperforming and we expect that to remain the case. We also believe that thesis extends down to the submarket or micro-market level, and as a result, believe investors should focus on infill industrial facilities that support last mile distribution strategies or are in ports with supply barriers.
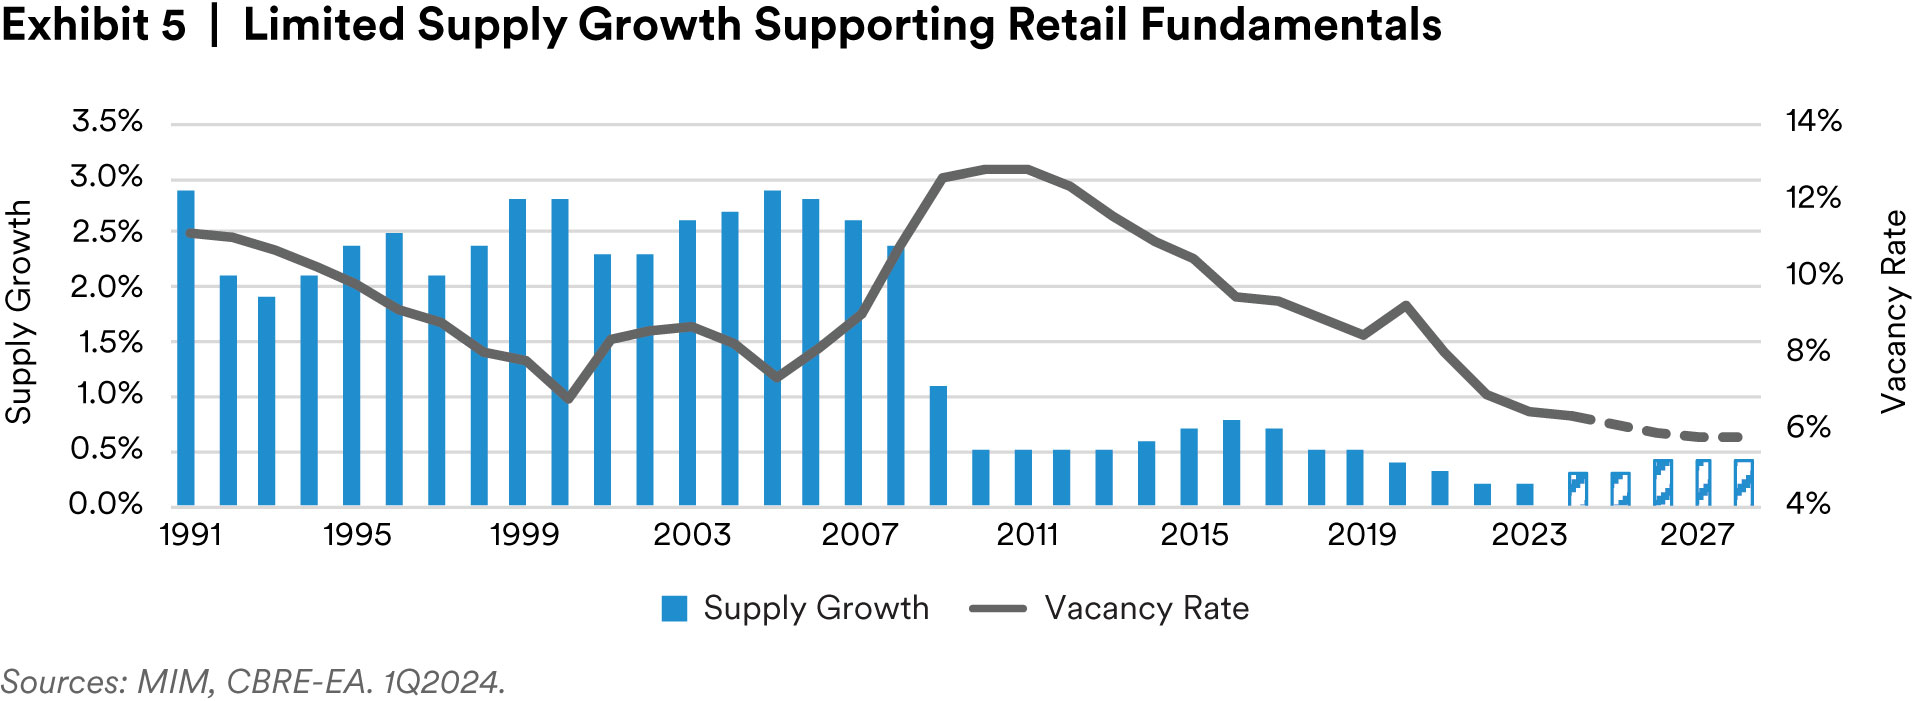
Retail investment remains a bright spot but may still not be receiving the credit it deserves. Retail vacancies, with the exception of the still-recovering mall subsector, are at the lowest level on record, yet developers remain unwilling to respond by delivering product into the historically tight market (exhibit 5). As a result, the outlook for retail income growth is the best it has been in many years, and we think this is particularly true for high-quality centers catering to experience-based tenants.4
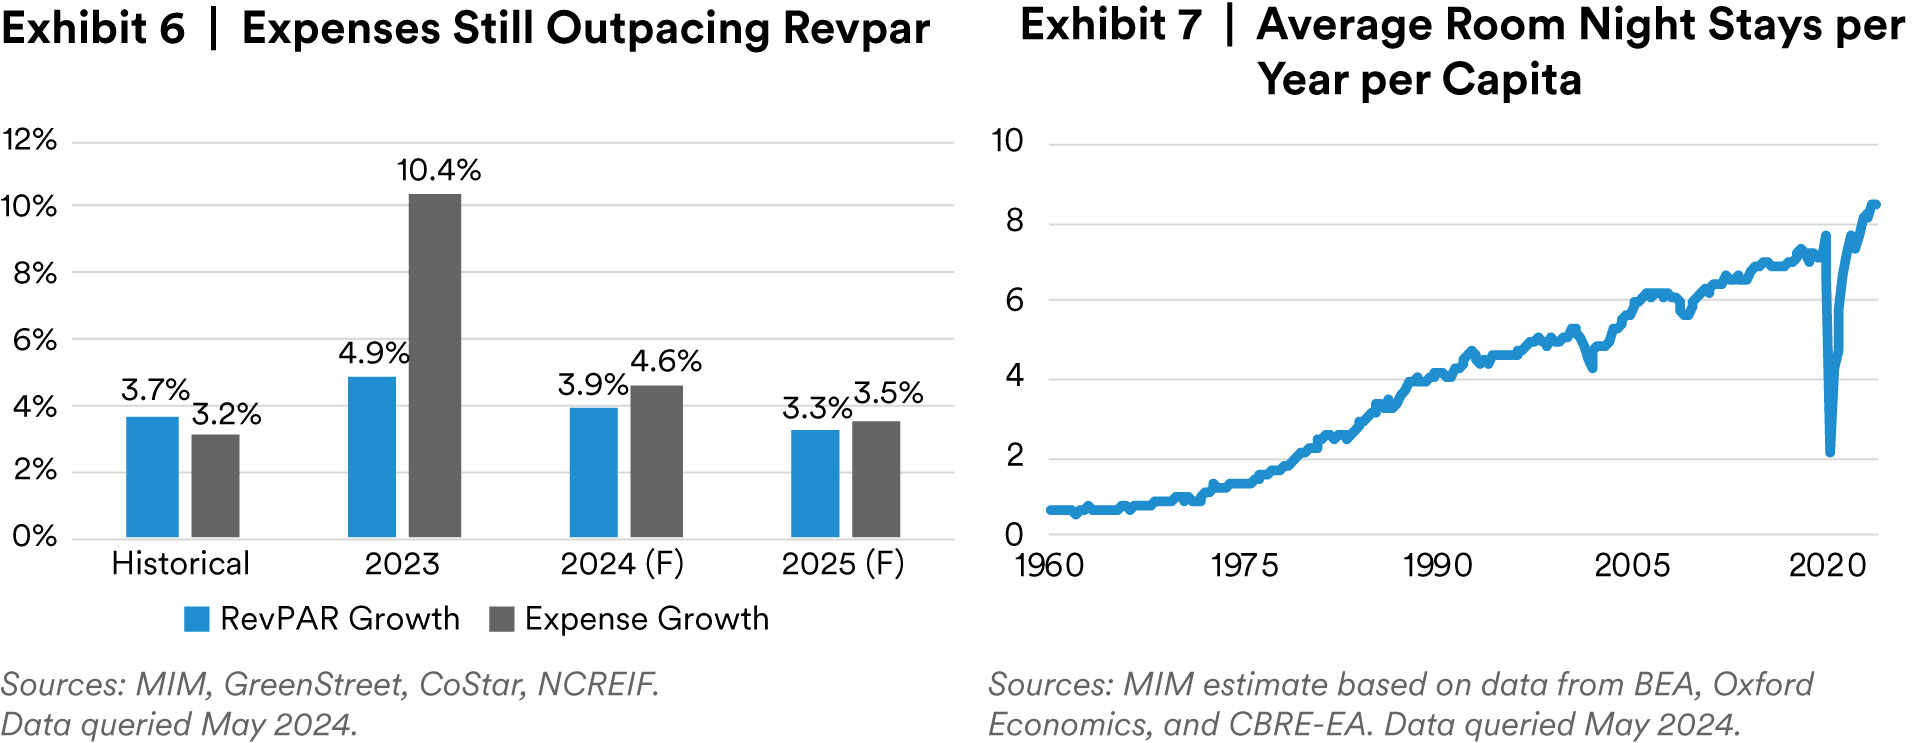
Lastly among the major property types, hotel demand is healthy, but expense growth remains a challenge. Expense growth significantly outstripped RevPAR in 2023, and while it has begun to moderate, may not be fully back in line with RevPAR growth until 2025 or 2026 (exhibit 6). As a result, we continue to recommend limited-service hotels over full-service hotels due to more favorable operating expense ratios that are less susceptible to rising operating expenses.
On the demand side, a healthy economy, strong consumer spending, and stable business optimism are being reflected in the hotel sector’s performance, but of equal importance in our view is the continued incremental demand being driven by the digital nomad trend.
The average number of room-night stays per working-age U.S. resident rose from around 2 nights per year in the 1970’s, to around 7 nights per year prior to COVID, and now sits at around 8 nights per year as of the end of 2023 (exhibit 7). We expect roughly 3.9% RevPAR growth this year.5
Property Type Recommendations
In MIM’s quarterly real estate market updates, we frequently review our property type overweight/ underweight guidance. In the past, this has been based on a Delphi survey of MIM’s seven regional acquisitions teams located across major U.S. markets, to assess current spot market yields for stabilized properties across all the core and alternative property types. We then apply risk adjustments based on forecasted supply/demand conditions, historical investment performance volatility, operating expense loads, and average CapEx needs to estimate the risk-adjusted returns being offered in the market. In the table below, this is referred to as MIM’s “internal” score.
More recently, this analysis has been expanded to include an “external” score, which is primarily based on public market REIT pricing. We have begun integrating data on REIT pricing, price-to-NAV ratios, and near-term income growth outlook as reported by REITs in their forward guidance. As a measure of how the market is pricing volatility for the various property types, we also capture options-implied volatility for each REIT. The various REITs are then categorized by property type.
The data show some differences between how public markets rank relative value across property types, and what we aggregate and forecast based on our internal/direct portfolio data. Generally, we believe infill warehouses, net-lease retail, and seniors housing offer the best relative value today. Full-service hotels, office, and grocery-anchored retail fall towards the bottom of the list and receive underweight recommendations.

Importantly, this analysis is an unconstrained view that does not consider critical factors like debt availability, portfolio diversification, liquidity, operational challenges or economies of scale, MSA exposures (i.e., Life Science may only be available in several markets), or higher yielding strategies such as value-add or new development, etc.
Conclusion
The commercial real estate sector is at an inflection point. Property prices declined precipitously over the past two years and are beginning to find their footing. However, the recovery cycle may not be immediate and may not occur in a straight line.
For the remainder of the year, we are focused on how capital market conditions evolve, relying on our analysis of real estate equity yields and bond prices as a guidepost. Property fundamentals are stable, and we welcome glimmers of light in the office sector. Market selection will remain particularly important in the multifamily and industrial sectors this year, where a handful of markets are facing supply challenges.
The economic outlook remains positive, and we believe that the resilience of the U.S. consumer will enable the U.S. economy and many real estate sectors to successfully overcome the challenges of the year ahead.
Endnotes
1 CME Group. May 2024.
2 MIM, CoStar. May 2024.
3 CBRE-EA. 1Q2024.
4 Ibid.
5 MIM, CoStar. May 2024.
Disclaimer
This material is intended solely for Institutional Investors, Qualified Investors and Professional Investors. This analysis is not intended for distribution with Retail Investors.
This document has been prepared by MetLife Investment Management (“MIM”)1 solely for informational purposes and does not constitute a recommendation regarding any investments or the provision of any investment advice, or constitute or form part of any advertisement of, offer for sale or subscription of, solicitation or invitation of any offer or recommendation to purchase or subscribe for any securities or investment advisory services. The views expressed herein are solely those of MIM and do not necessarily reflect, nor are they necessarily consistent with, the views held by, or the forecasts utilized by, the entities within the MetLife enterprise that provide insurance products, annuities and employee benefit programs. The information and opinions presented or contained in this document are provided as of the date it was written. It should be understood that subsequent developments may materially affect the information contained in this document, which none of MIM, its affiliates, advisors or representatives are under an obligation to update, revise or affirm. It is not MIM’s intention to provide, and you may not rely on this document as providing, a recommendation with respect to any particular investment strategy or investment. Affiliates of MIM may perform services for, solicit business from, hold long or short positions in, or otherwise be interested in the investments (including derivatives) of any company mentioned herein. This document may contain forward-looking statements, as well as predictions, projections and forecasts of the economy or economic trends of the markets, which are not necessarily indicative of the future. Any or all forward-looking statements, as well as those included in any other material discussed at the presentation, may turn out to be wrong.
All investments involve risks including the potential for loss of principle and past performance does not guarantee similar future results. Property is a specialist sector that may be less liquid and produce more volatile performance than an investment in other investment sectors. The value of capital and income will fluctuate as property values and rental income rise and fall. The valuation of property is generally a matter of the valuers’ opinion rather than fact. The amount raised when a property is sold may be less than the valuation. Furthermore, certain investments in mortgages, real estate or non-publicly traded securities and private debt instruments have a limited number of potential purchasers and sellers. This factor may have the effect of limiting the availability of these investments for purchase and may also limit the ability to sell such investments at their fair market value in response to changes in the economy or the financial markets.
In the U.S. this document is communicated by MetLife Investment Management, LLC (MIM, LLC), a U.S. Securities Exchange Commission registered investment adviser. MIM, LLC is a subsidiary of MetLife, Inc. and part of MetLife Investment Management. Registration with the SEC does not imply a certain level of skill or that the SEC has endorsed the investment advisor.
For investors in the UK, this document is being distributed by MetLife Investment Management Limited (“MIML”), authorised and regulated by the UK Financial Conduct Authority (FCA reference number 623761), registered address One Angel Lane 8th Floor London EC4R 3AB United Kingdom. This document is approved by MIML as a financial promotion for distribution in the UK. This document is only intended for, and may only be distributed to, investors in the UK who qualify as a “professional client” as defined under the Markets in Financial Instruments Directive (2014/65/EU), as per the retained EU law version of the same in the UK.
For investors in the Middle East: This document is directed at and intended for institutional investors (as such term is defined in the various jurisdictions) only. The recipient of this document acknowledges that (1) no regulator or governmental authority in the Gulf Cooperation Council (“GCC”) or the Middle East has reviewed or approved this document or the substance contained within it, (2) this document is not for general circulation in the GCC or the Middle East and is provided on a confidential basis to the addressee only, (3) MetLife Investment Management is not licensed or regulated by any regulatory or governmental authority in the Middle East or the GCC, and (4) this document does not constitute or form part of any investment advice or solicitation of investment products in the GCC or Middle East or in any jurisdiction in which the provision of investment advice or any solicitation would be unlawful under the securities laws of such jurisdiction (and this document is therefore not construed as such). For investors in Japan: This document is being distributed by MetLife Asset Management Corp. (Japan) (“MAM”), a registered Financial Instruments Business Operator (“FIBO”) under the registration entry Director General of the Kanto Local Finance Bureau (FIBO) No. 2414, a regular member of the Japan Investment Advisers Association and the Type II Financial Instruments Firms Association of Japan. As fees to be borne by investors vary depending upon circumstances such as products, services, investment period and market conditions, the total amount nor the calculation methods cannot be disclosed in advance. All investments involve risks including the potential for loss of principle and past performance does not guarantee similar future results. Investors should obtain and read the prospectus and/or document set forth in Article 37-3 of Financial Instruments and Exchange Act carefully before making the investments.
For Investors in Hong Kong S.A.R.: This document is being issued by MetLife Investments Asia Limited (“MIAL”), a part of MIM, and it has not been reviewed by the Securities and Futures Commission of Hong Kong (“SFC”). MIAL is licensed by the Securities and Futures Commission for Type 1 (dealing in securities), Type 4 (advising on securities) and Type 9 (asset management) regulated activities.
For investors in Australia: This information is distributed by MIM LLC and is intended for “wholesale clients” as defined in section 761G of the Corporations Act 2001 (Cth) (the Act). MIM LLC exempt from the requirement to hold an Australian financial services license under the Act in respect of the financial services it provides to Australian clients. MIM LLC is regulated by the SEC under US law, which is different from Australian law.
MIMEL: For investors in the EEA, this document is being distributed by MetLife Investment Management Europe Limited (“MIMEL”), authorised and regulated by the Central Bank of Ireland (registered number: C451684), registered address 20 on Hatch, Lower Hatch Street, Dublin 2, Ireland. This document is approved by MIMEL as marketing communications for the purposes of the EU Directive 2014/65/EU on markets in financial instruments (“MiFID II”). Where MIMEL does not have an applicable cross-border licence, this document is only intended for, and may only be distributed on request to, investors in the EEA who qualify as a “professional client” as defined under MiFID II, as implemented in the relevant EEA jurisdiction. The investment strategies described herein are directly managed by delegate investment manager affiliates of MIMEL. Unless otherwise stated, none of the authors of this article, interviewees or referenced individuals are directly contracted with MIMEL or are regulated in Ireland. Unless otherwise stated, any industry awards referenced herein relate to the awards of affiliates of MIMEL and not to awards of MIMEL.
1 MetLife Investment Management (“MIM”) is MetLife, Inc.’s institutional management business and the marketing name for subsidiaries of MetLife that provide investment management services to MetLife’s general account, separate accounts and/or unaffiliated/ third party investors, including: Metropolitan Life Insurance Company, MetLife Investment Management, LLC, MetLife Investment Management Limited, MetLife Investments Limited, MetLife Investments Asia Limited, MetLife Latin America Asesorias e Inversiones Limitada, MetLife Asset Management Corp. (Japan), and MIM I LLC, MetLife Investment Management Europe Limited and Affirmative Investment Management Partners Limited.


