Economy
The outlook for the U.S. economy and commercial real estate continued to improve in the first quarter of 2021. Vaccine effectiveness has been as strong as expected1, and should be available to the general public in the U.S. in a matter of weeks. This helps alleviate one of the primary risks (vaccine distribution) that we outlined in our 2021 Outlook report, The Winding Path to Recovery.
The unemployment rate is less than half of peak unemployment from the early months of the outbreak, and we expect it to reach 5.0% by the end of the year. The recently passed $1.9 trillion economic stimulus package, and potential $3 trillion infrastructure package that is still being worked on in Washington, suggests GDP growth could be at least 5.5% this year2.
Real Estate & Reflation
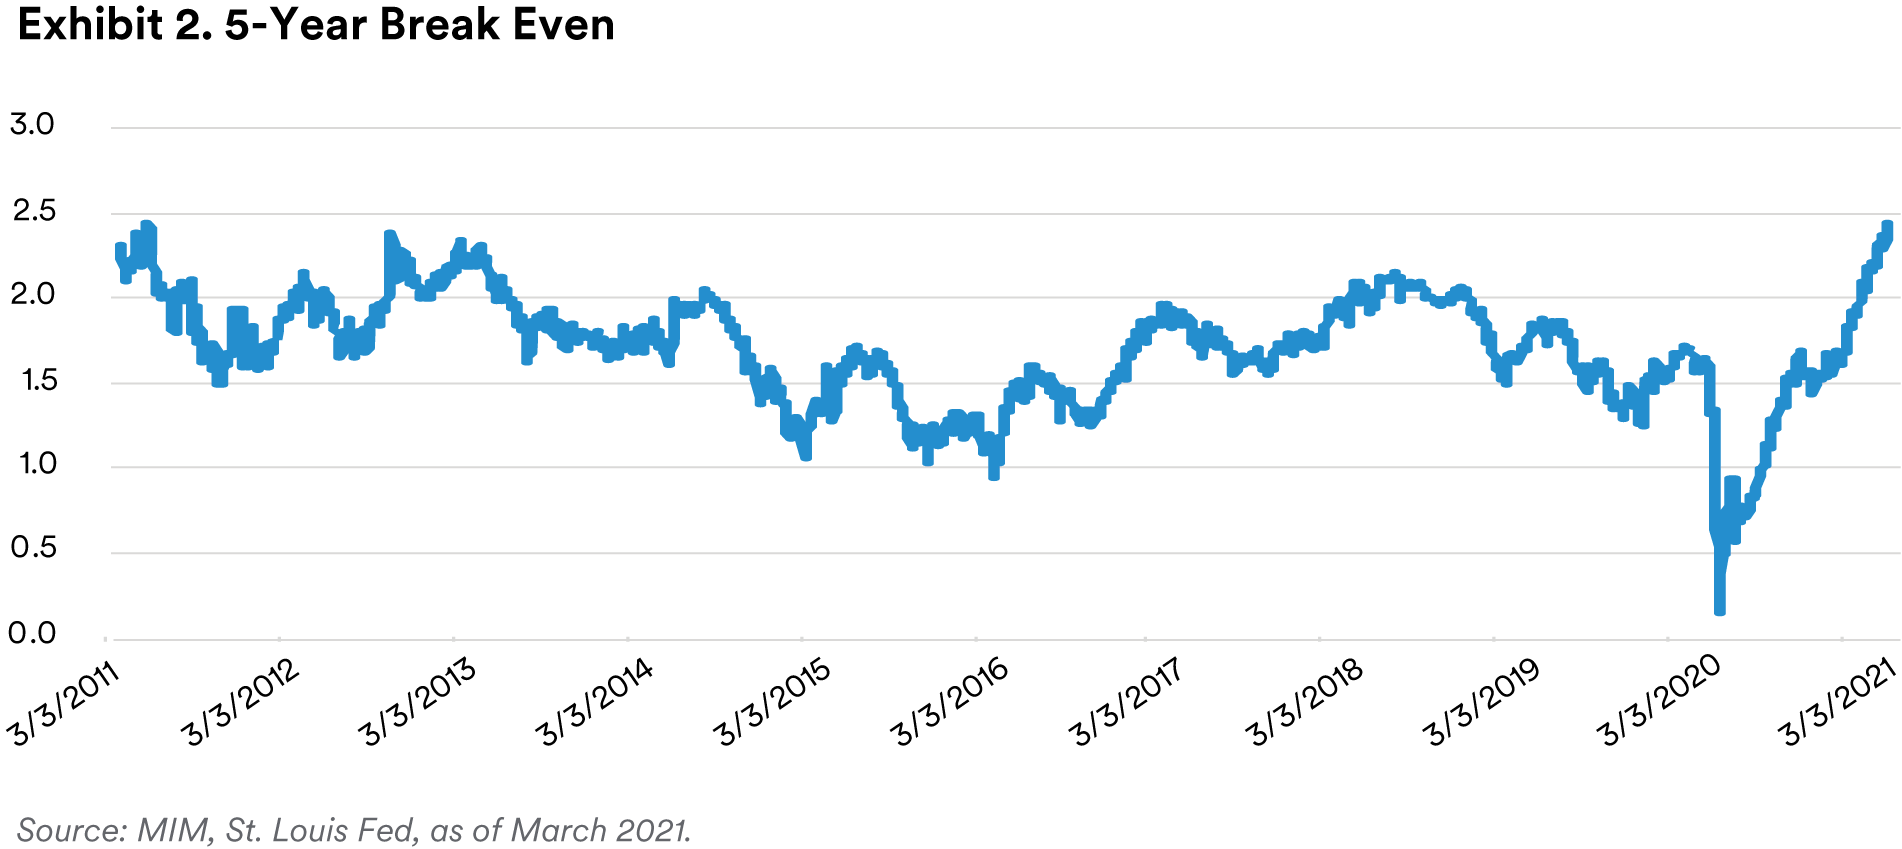
A recovering economy and multiple rounds of fiscal stimulus have stoked inflation fears and sent treasuries sharply higher in recent months. Shown in Exhibit 2, the U.S. 5-yr inflation breakeven rate – an indicator of where the market believes inflation will be in five years – recently reached its highest level (2.45%) since the wake of the Global Financial Crisis.
While we anticipate a modest pickup in inflation during 2021, we suspect it will be more transitory, and a function of the volatility in price levels exhibited during 2020. We do not believe inflation is likely to remain high until slack from the labor market is removed, however. Although this may occur in 2022 or beyond, for now we do not believe sustained inflation is likely to occur while the unemployment rate remains above 4%.
Still, inflation fears have begun impacting interest rates, and the bellwether 10-year treasury rate could end the year at 1.75% (from 0.92% in 2020), and the CPI-U could rise to 2.0% in 2021 (1.4% in 2020).3
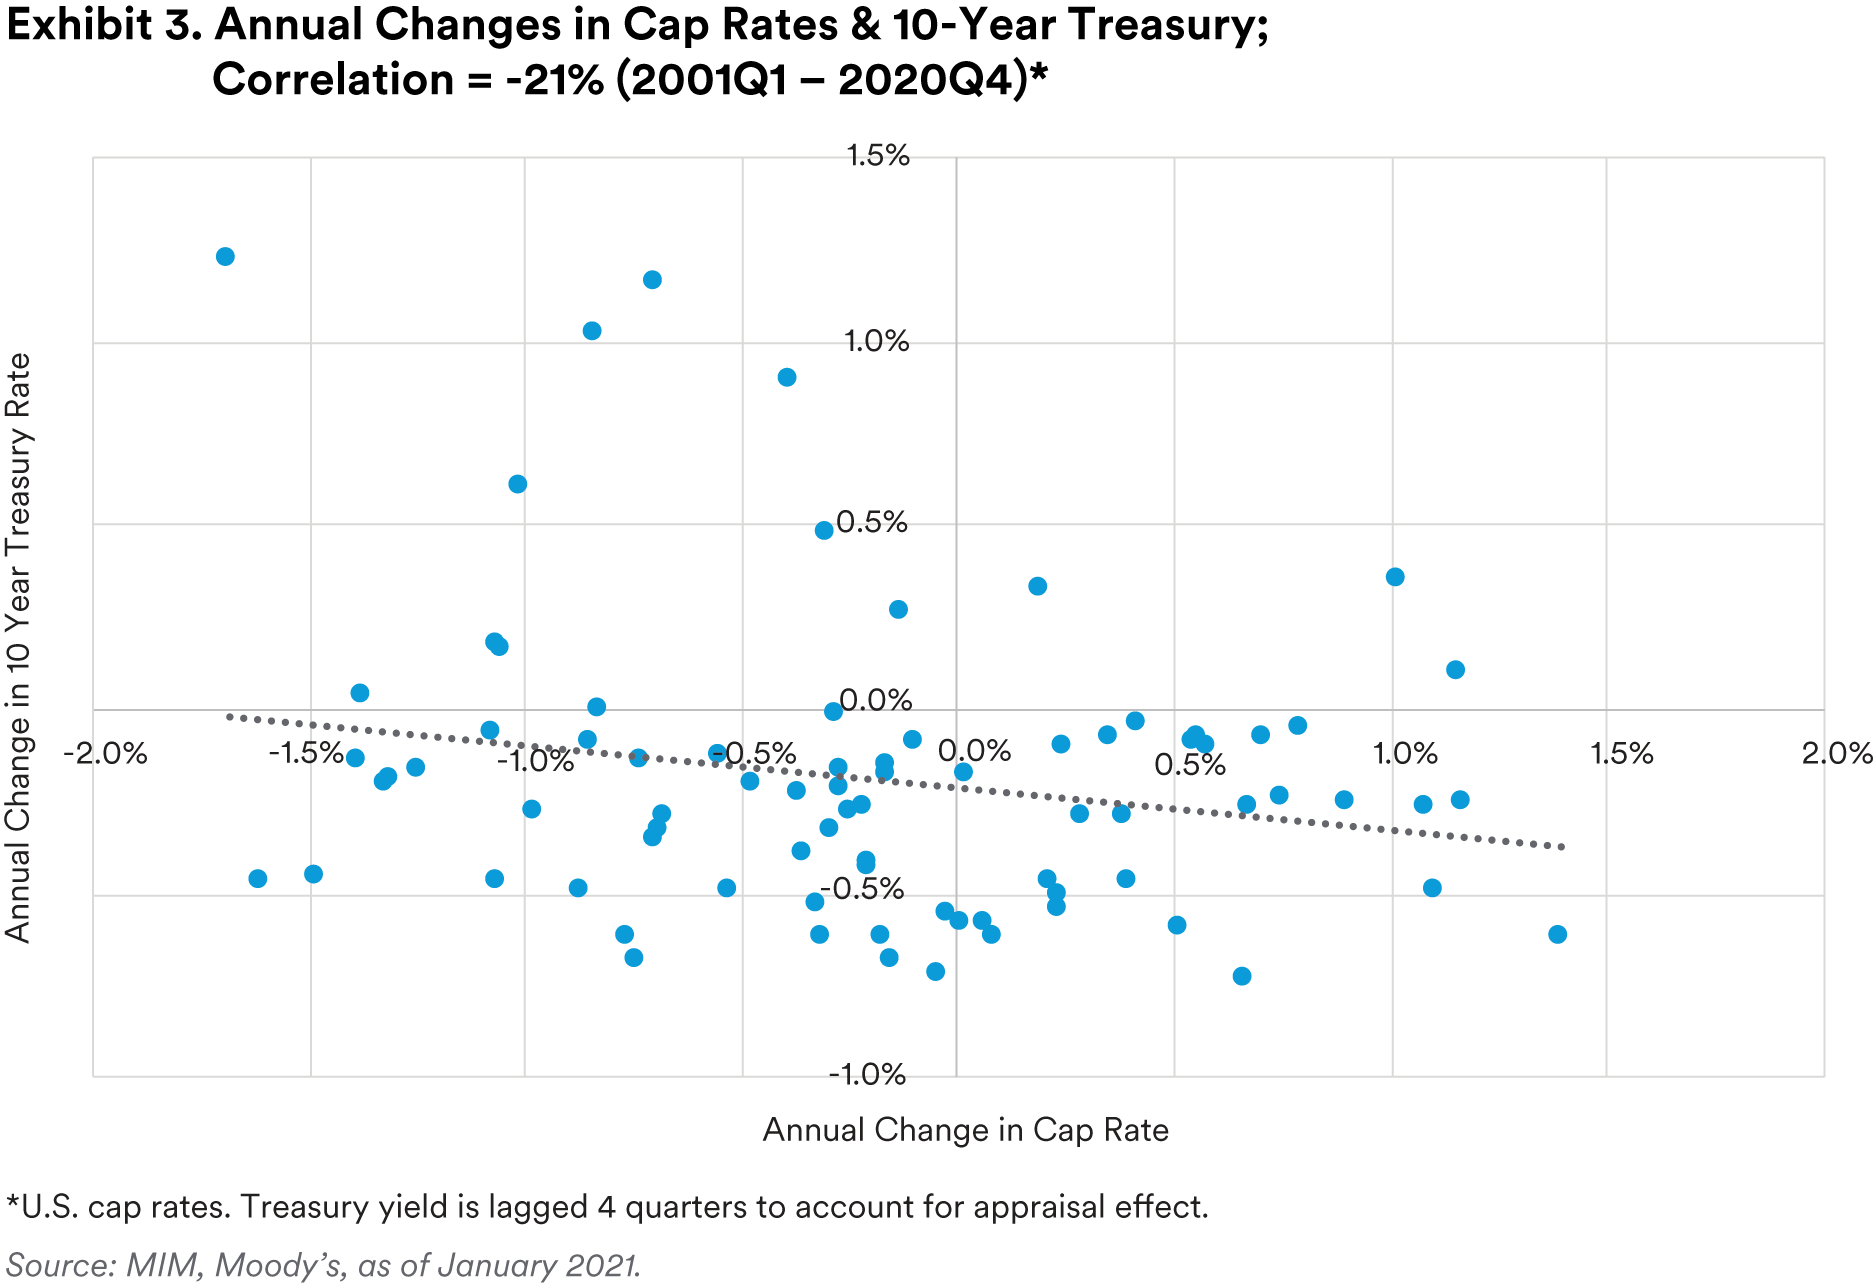
Although rising interest rates tend to translate into fears of rising cap rates, history suggests that they are rarely correlated. In fact, because real estate is pro-cyclical, the trend between interest rates and cap rates can be negatively correlated during times when the economy is expanding or contracting (Exhibit 3). As an example, from 2003 – 2007 when the economy was improving, treasury rates rose from 3.3% to 5.1%, while cap rates compressed from 8.0% to 5.7%. From 2008 – 2012, when economic conditions were depressed, treasury rates declined from 4.1% to 2.6%, while cap rates rose from 5.1% to 6.6%.
Looking forward, we expect an improving economy to drive down risk premiums across the investment spectrum, including commercial real estate. We believe this will translate to a compressing cap rate spread to the 10-year treasury, and declining cap rates, even as treasury rates rise off their COVID lows. If treasuries rise to the mid-2% range, and U.S. GDP growth remains in the 5% to 7% range, then we would begin to be concerned about potential cap rate expansion.
Office Sector Update
So far, it’s been challenging to make sense of how firms are planning to adjust their office footprint today, and even more so in the future. Almost every week a Fortune 500 company is announcing a large new office lease renewal or expansion, while another is announcing they are making work-from-home permanent. We’ve also noticed these types of mixed trends in the MIM office portfolio, and from the leasing brokers and corporate real estate professionals that we work with.
That said, when we cut beyond headlines to aggregated leasing statistics, we find that the average U.S. office vacancy rate rose from 12.8% to 15.0% over the last year5, slightly less of an increase than we were expecting when we wrote Back to Work: Office Demand in a Post Pandemic World in May of 2020. Looking forward, we continue to expect vacancy to rise modestly above the peak levels realized during the Global Financial Crisis (16.7%)6 later this year or in early 2022. By 2023, however, and as we also detailed in Back to Work, we believe many firms will be reversing their decisions to work remotely permanently.
One issue with using an aggregate vacancy statistic is that it is a lagging indicator, and to some extent the increases in vacancy will be limited by the pace at which typical 5- or 10-year office leases are maturing. To potentially help answer the question of what companies have been doing, we developed a tool that estimates the percent of expiring office space being renewed across markets . Although only a rough approximation, we believe it has historically been a useful barometer of market-level office performance in the past.
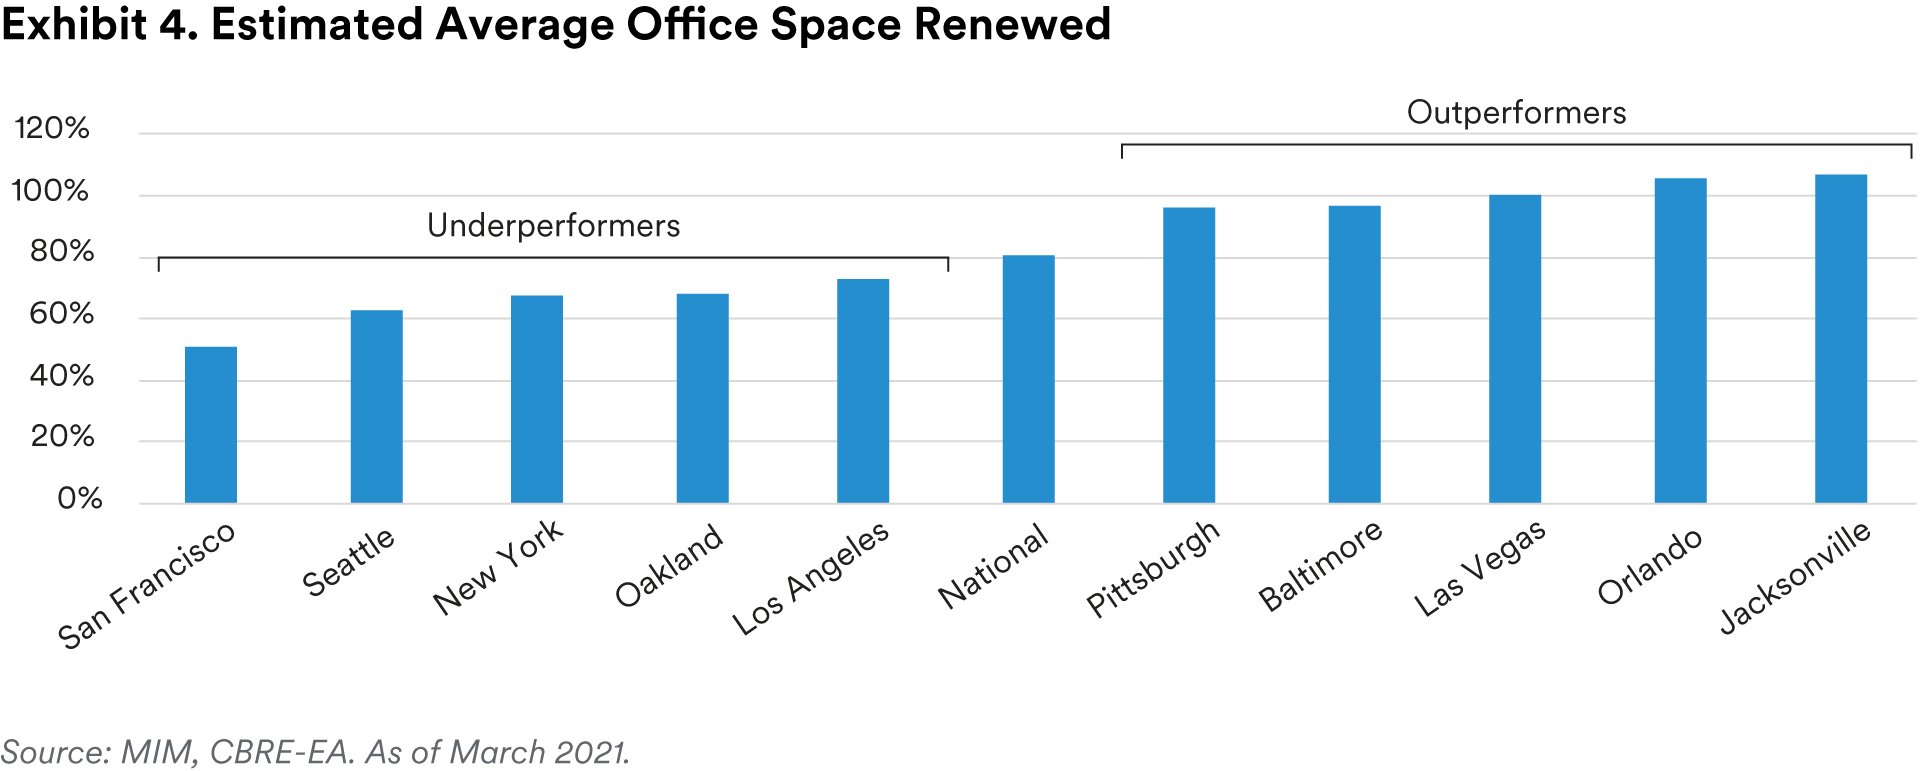
In Exhibit 4, we modeled renewals for both 3Q20 and 4Q20. Markets such as San Francisco, New York, and Seattle have experienced some of the lowest average rates of office space renewal, compared to the rest of the U.S., which averaged an 80% renewal rate. On the flip side, of the total office space that was up for renewal during the second half of 2020, more than all of it was absorbed / renewed in markets such as Orlando and Jacksonville (each over 100%). The standard vacancy statistics also confirm this trend, with markets like San Francisco rising from 5.2% to 11.7%, and markets like Minneapolis only rising from 18.5% to 18.9%.
In our most recent office whitepaper, The Pandemic Pitfall, we outline how this office work-from-home adoption could vary by city based on factors such as public transit usage, household income levels, the concentration of tech workers, and the age of the office using workforce. We expected weakness in San Francisco, Seattle, and Denver7, although also said that we believe those markets could offer some of the best tactical/pricing opportunities in the near-term. We continue to believe that to be the case, although acknowledge that none of these markets are yet pricing office assets at meaningful discounts to pre-Covid levels, in our view.
Industrial
The industrial sector continues to shine relative to other core property types as the pandemic has accelerated preexisting demand growth (Exhibit 5). Stay-at-home orders related to the pandemic accelerated e-commerce adoption as we estimate the number of people regularly buying goods online jumped from 55% pre-Covid to around 75% today8. That said, rather than just the absolute level of e-commerce sales growth, we believe the continued push for faster delivery times is driving the outperformance.
Industrial occupiers are more willing to absorb large rent increases in assets that are located in densely populated areas, also referred to as “infill” assets. These buildings enable third party logistics providers to satisfy the burgeoning demand for faster delivery times, and have notably outperformed their regional counterparts over the last cycle. Since the GFC, infill industrial rent growth has averaged 6.3% annually, while regional assets averaged 3.9% annually (Exhibit 5).
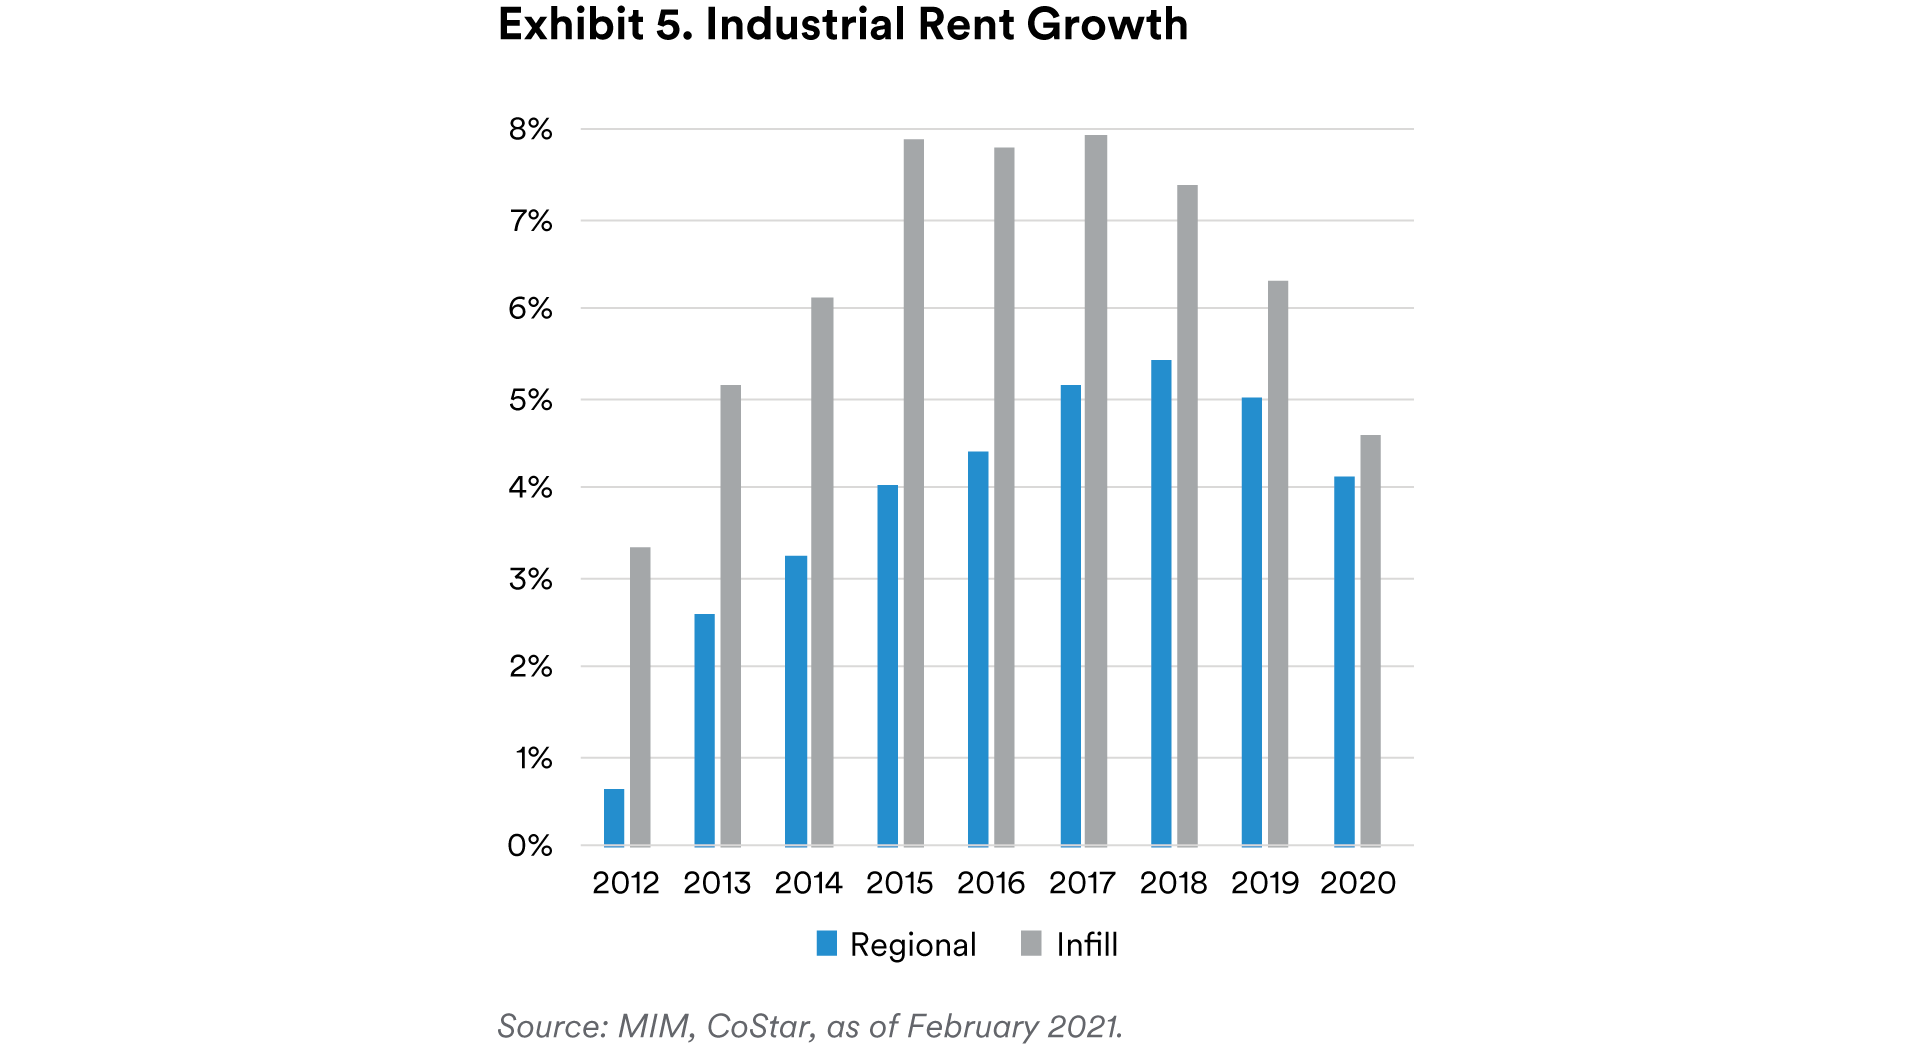
We believe infill industrial demand will remain strong until four-hour delivery is available in most markets, down from 1 to 2-day delivery speeds that are typical today. As a result, we believe it is appropriate to expect 5% to 10% in cumulative additional rent growth from 2021-2024 for infill assets as compared to rural/regional distribution assets. At the national level, we therefore expect around 3.3% annual rent growth 2021-2024 for regional assets, and 5.3% annual rent growth for infill assets.

Retail
Retail assets – particularly those with non-essential tenants – have generally struggled throughout the pandemic as stores temporarily closed and foot traffic fell dramatically. Additionally, leading up to the pandemic, the retail sector was already experiencing secular challenges as consumers increasingly shopped online, and we believe the pandemic has likely accelerated this trend of e-commerce adoption.

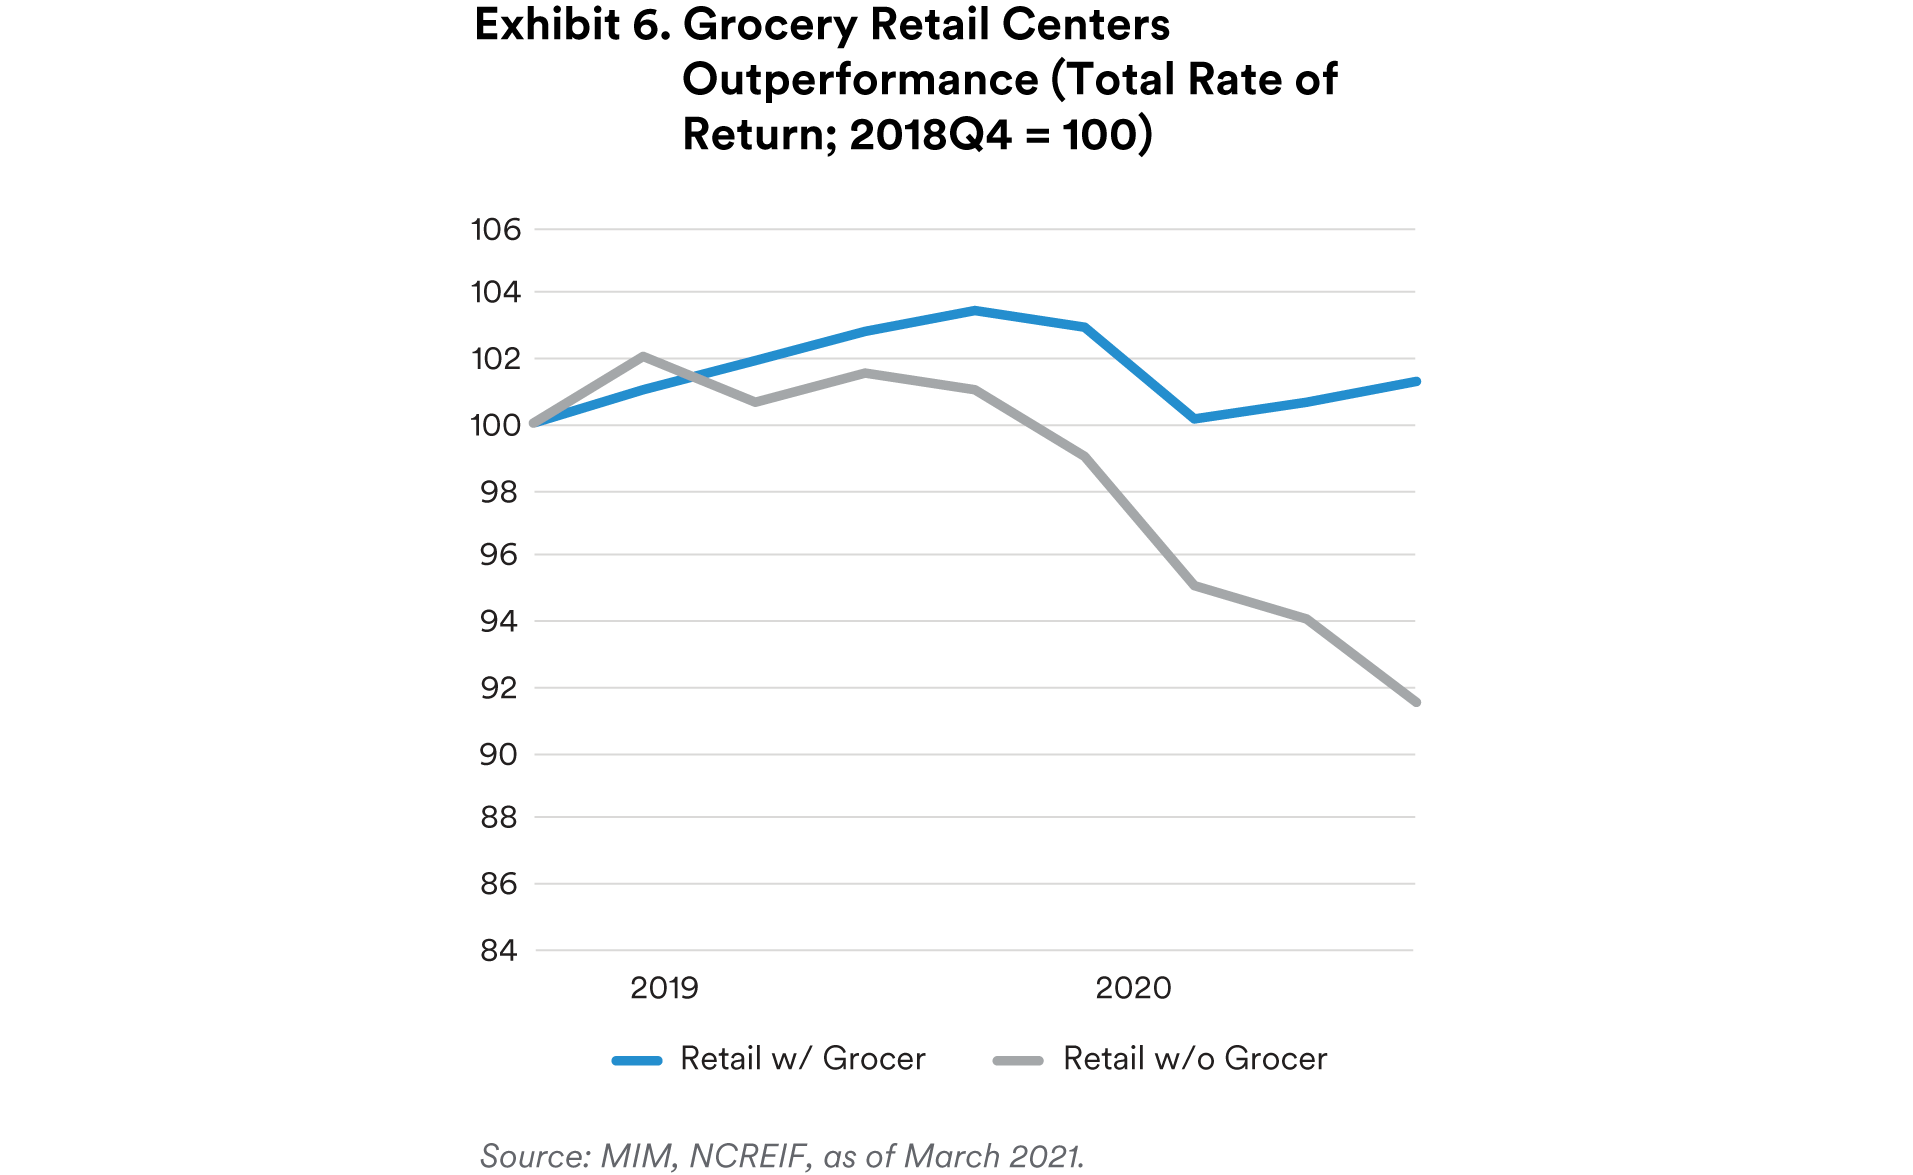
Around 25,000 retail stores were closed last year9, although the challenges were not evenly distributed. Malls, for instance, make up less than 10% of total existing retail space, yet they accounted for roughly 35% of the existing retail footprints of all of the retailers that announced closures in 2020.10 On the flip side, shopping centers anchored by essential retailers such as grocery stores have remained open, and rent collections remain strong at nearly 100%.11
This outperformance in grocery anchored retail is not a new trend for real estate investors as the sector is widely regarded for being more resilient e-commerce spending (Exhibit 6). However, we believe e-grocery spending patterns – also accelerated by the pandemic – could be worth monitoring. In 2019, only around 5% of groceries were purchased online; that figure rose to 10% in 2020 and could reach 12% by 2025.12 In our view, similar to the retail sector as a whole, grocers who are unable to enhance their omnichannel strategies going forward (ex: curbside pickup) could be at risk to rising online grocery trends.
Zooming out more broadly, we believe there could be select opportunities in the retail sector going forward, particularly those offering experiential elements. Over the past several decades, consumers across all generations have been spending more on experiences and less on goods, and we expect this trend to continue. Although these experience-based retailers such as gyms, restaurants, etc. are struggling with social distancing measures today, we believe these types of tenants could outperform in the long-term.
Apartment
Demand growth moderated only slightly for the apartment sector in 2020 as vacancies ticked up from 4.1% to 4.5%.13 That said, assets located in central business districts (CBD) have struggled more than their suburban counterparts, and rents in CBD locations remain below their pre-pandemic peaks14. With employees no longer commuting to the office and working from home, the appeal of living in high-cost urban areas has temporarily shown signs of deterioration; as such, densely populated gateway markets such as San Francisco and New York have struggled over the last 12 months (Exhibit 7).
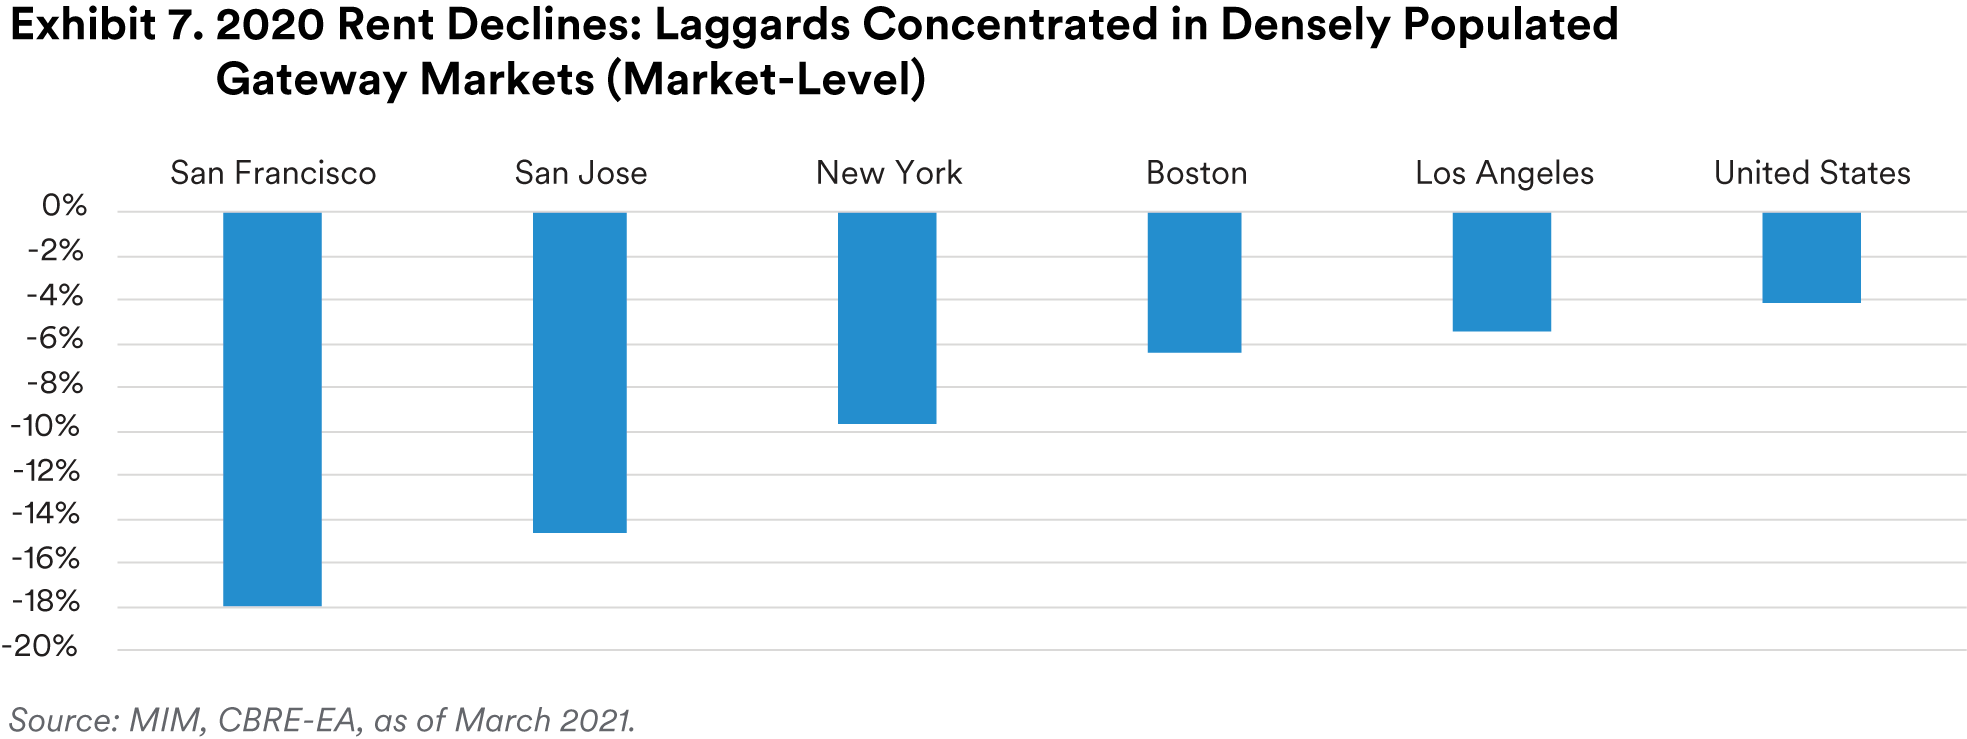
We believe fundamentals in densely populated urban areas will remain soft during the remainder of 2021. However, given we expect workforces to largely return to an office environment, employees who migrated out of city-centers could return to the “live, work, play” dynamic that they enjoyed prior to Covid-19.

One additional important and sometimes overlooked dynamic of apartment leasing over the last year has been the demand for larger vs smaller units. As illustrated in Exhibit 8, three-bedroom apartment rents never skipped a beat throughout the pandemic, and have been growing at a faster clip relative to other unit types.
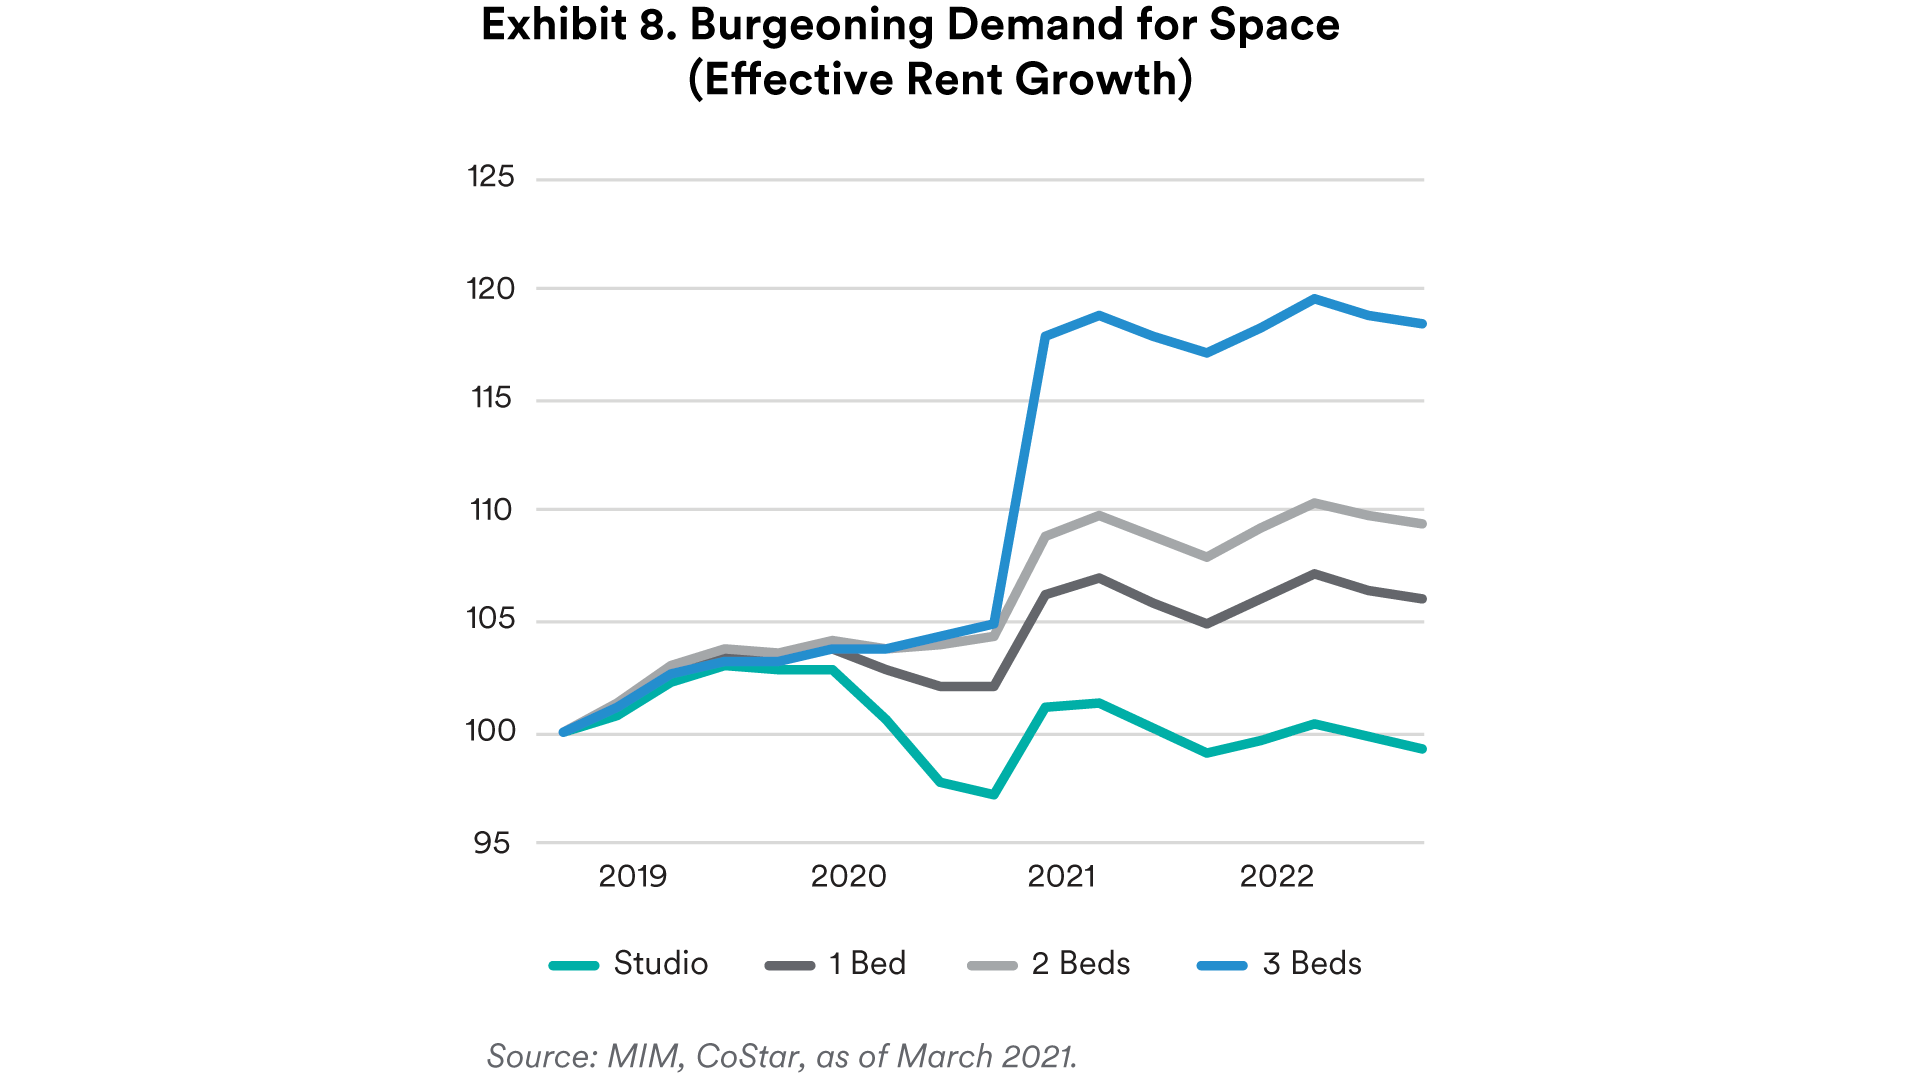
In our view, the higher rent growth for larger unit types could be attributable to the need for employees to enhance their remote working accommodations, as well as the Millennial generation due to the cohort aging into their 30s and forming households, a trend that we identified in a 2016 whitepaper Echoing the Boom. When considering only 12% of apartment units in the U.S. have three or more bedrooms15, we expect fundamentals to remain healthy for assets with a higher concentration 2 and 3 bedroom units.
Hotel
The hotel sector has been the most directly and severely impacted by Covid-19. Virtually overnight, leisure and business travel came to a halt, and many hotels were forced to temporarily close their doors. As we detail in our recent whitepaper, A Stigmatized Sector – Our Outlook for U.S. Hotel Investments – the hotel sector is currently in a liquidity and capital markets crisis, but we believe there’s light at the end of the tunnel.

Given the steady progress with the vaccine distribution in the U.S., we believe hotel occupancies have likely reached a trough and will steadily recovery until reaching pre-Covid demand by 2022 or 2023. That said, the recovery will likely be uneven across hotel subtypes. On one hand, the K-shaped downturn and recovery suggests leisure hotel demand could recover even quicker, a thesis that is already supported by summer reservation data within the MIM portfolio. On the other hand, we expect segments reliant on group and business travel to recover at a much slower rate due to the increased adoption of virtual meetings.
Wide bid-ask spreads persist in the equity investment market, but we believe there could be attractive opportunities in the near-term. In the mortgage space, we believe both senior and subordinate pricing is attractive, and readily available at scale.
Conclusion
Economic downturns can often create attractive investment opportunities, and while they are more challenging to find today than was the case after the 2008 global financial crisis, we feel they are still abundant in commercial real estate. In our view, the hotel debt sector presents some of the most compelling, and scalable, opportunities available today. We believe fundamentals remain positive for apartment and industrial assets, and select opportunities remain available for careful investors in the office and retail space. The cap rate to 10-year treasury spread continues to suggest strong value in the real estate sector, in our view, and we expect flat to modestly compressing cap rates during the remainder of 2021.
Endnotes
1 John’s Hopkins OpEd in WSJ, as of February 2021.
2 MIM Forecast, as of February 2021.
3 MIM Forecast, as of February 2021.
4 MIM, Moody’s, NCREIF, as of March 2021.
5 CBRE-EA, as of February 2021.
6 Ibid.
7 Ibid.
8 MIM, Axciom, as of 3Q20.
9 Coresight Research, as of January 2020.
10 CoStar, as of February 2021.
11 Green Street, as of 3Q20.
12 Bain & Co. forecast, as of March 2021.
13 CBRE-EA, as of February 2021.
14 CoStar, as of January 2020.
15 Census Bureau, as of June 2020.
Disclosure
This material is intended solely for Institutional Investors, Qualified Investors and Professional Investors. This analysis is not intended for distribution with Retail Investors.
This document has been prepared by MetLife Investment Management (“MIM”)1 solely for informational purposes and does not constitute a recommendation regarding any investments or the provision of any investment advice, or constitute or form part of any advertisement of, offer for sale or subscription of, solicitation or invitation of any offer or recommendation to purchase or subscribe for any securities or investment advisory services. The views expressed herein are solely those of MIM and do not necessarily reflect, nor are they necessarily consistent with, the views held by, or the forecasts utilized by, the entities within the MetLife enterprise that provide insurance products, annuities and employee benefit programs. The information and opinions presented or contained in this document are provided as the date it was written. It should be understood that subsequent developments may materially affect the information contained in this document, which none of MIM, its affiliates, advisors or representatives are under an obligation to update, revise or affirm. It is not MIM’s intention to provide, and you may not rely on this document as providing, a recommendation with respect to any particular investment strategy or investment. Affiliates of MIM may perform services for, solicit business from, hold long or short positions in, or otherwise be interested in the investments (including derivatives) of any company mentioned herein. This document may contain forward-looking statements, as well as predictions, projections and forecasts of the economy or economic trends of the markets, which are not necessarily indicative of the future. Any or all forward-looking statements, as well as those included in any other material discussed at the presentation, may turn out to be wrong.
All investments involve risks including the potential for loss of principle and past performance does not guarantee similar future results. Property is a specialist sector that may be less liquid and produce more volatile performance than an investment in other investment sectors. The value of capital and income will fluctuate as property values and rental income rise and fall. The valuation of property is generally a matter of the valuers’ opinion rather than fact. The amount raised when a property is sold may be less than the valuation. Furthermore, certain investments in mortgages, real estate or non-publicly traded securities and private debt instruments have a limited number of potential purchasers and sellers. This factor may have the effect of limiting the availability of these investments for purchase and may also limit the ability to sell such investments at their fair market value in response to changes in the economy or the financial markets.
In the U.S. this document is communicated by MetLife Investment Management, LLC (MIM, LLC), a U.S. Securities Exchange Commission registered investment adviser. MIM, LLC is a subsidiary of MetLife, Inc. and part of MetLife Investment Management. Registration with the SEC does not imply a certain level of skill or that the SEC has endorsed the investment advisor.
This document is being distributed by MetLife Investment Management Limited (“MIML”), authorised and regulated by the UK Financial Conduct Authority (FCA reference number 623761), registered address Level 34 One Canada Square London E14 5AA United Kingdom. This document is only intended for, and may only be distributed to, investors in the EEA who qualify as a Professional Client as defined under the EEA’s Markets in Financial Instruments Directive, as implemented in the relevant EEA jurisdiction. The investment strategy described herein is intended to be structured as an investment management agreement between MIML (or its affiliates, as the case may be) and a client, although alternative structures more suitable for a particular client can be discussed.
For investors in the Middle East: This document is directed at and intended for institutional investors (as such term is defined in the various jurisdictions) only. The recipient of this document acknowledges that (1) no regulator or governmental authority in the Gulf Cooperation Council (“GCC”) or the Middle East has reviewed or approved this document or the substance contained within it, (2) this document is not for general circulation in the GCC or the Middle East and is provided on a confidential basis to the addressee only, (3) MetLife Investment Management is not licensed or regulated by any regulatory or governmental authority in the Middle East or the GCC, and (4) this document does not constitute or form part of any investment advice or solicitation of investment products in the GCC or Middle East or in any jurisdiction in which the provision of investment advice or any solicitation would be unlawful under the securities laws of such jurisdiction (and this document is therefore not construed as such).
For investors in Japan - This document is being distributed by MetLife Asset Management Corp. (Japan) (“MAM”), 1-3 Kioicho, Chiyoda-ku, Tokyo 102-0094, Tokyo Garden Terrace KioiCho Kioi Tower 25F, a registered Financial Instruments Business Operator (“FIBO”) No. 2414.
For Investors in Hong Kong - This document is being issued by MetLife Investments Asia Limited (“MIAL”), a part of MIM, and it has not been reviewed by the Securities and Futures Commission of Hong Kong (“SFC”).
For investors in Australia, this information is distributed by MIM LLC and is intended for “wholesale clients” as defined in section 761G of the Corporations Act 2001 (Cth) (the Act). MIM LLC exempt from the requirement to hold an Australian financial services license under the Act in respect of the financial services it provides to Australian clients. MIM LLC is regulated by the SEC under US law, which is different from Australian law.
1 MetLife Investment Management (“MIM”) is MetLife, Inc.’s institutional management business and the marketing name for subsidiaries of MetLife that provide investment management services to MetLife’s general account, separate accounts and/or unaffiliated/third party investors, including: Metropolitan Life Insurance Company, MetLife Investment Management, LLC, MetLife Investment Management Limited, MetLife Investments Limited, MetLife Investments Asia Limited, MetLife Latin America Asesorias e Inversiones Limitada, MetLife Asset Management Corp. (Japan), and MIM I LLC.
Unless otherwise noted, none of the authors of the articles on this page are regulated in Ireland.