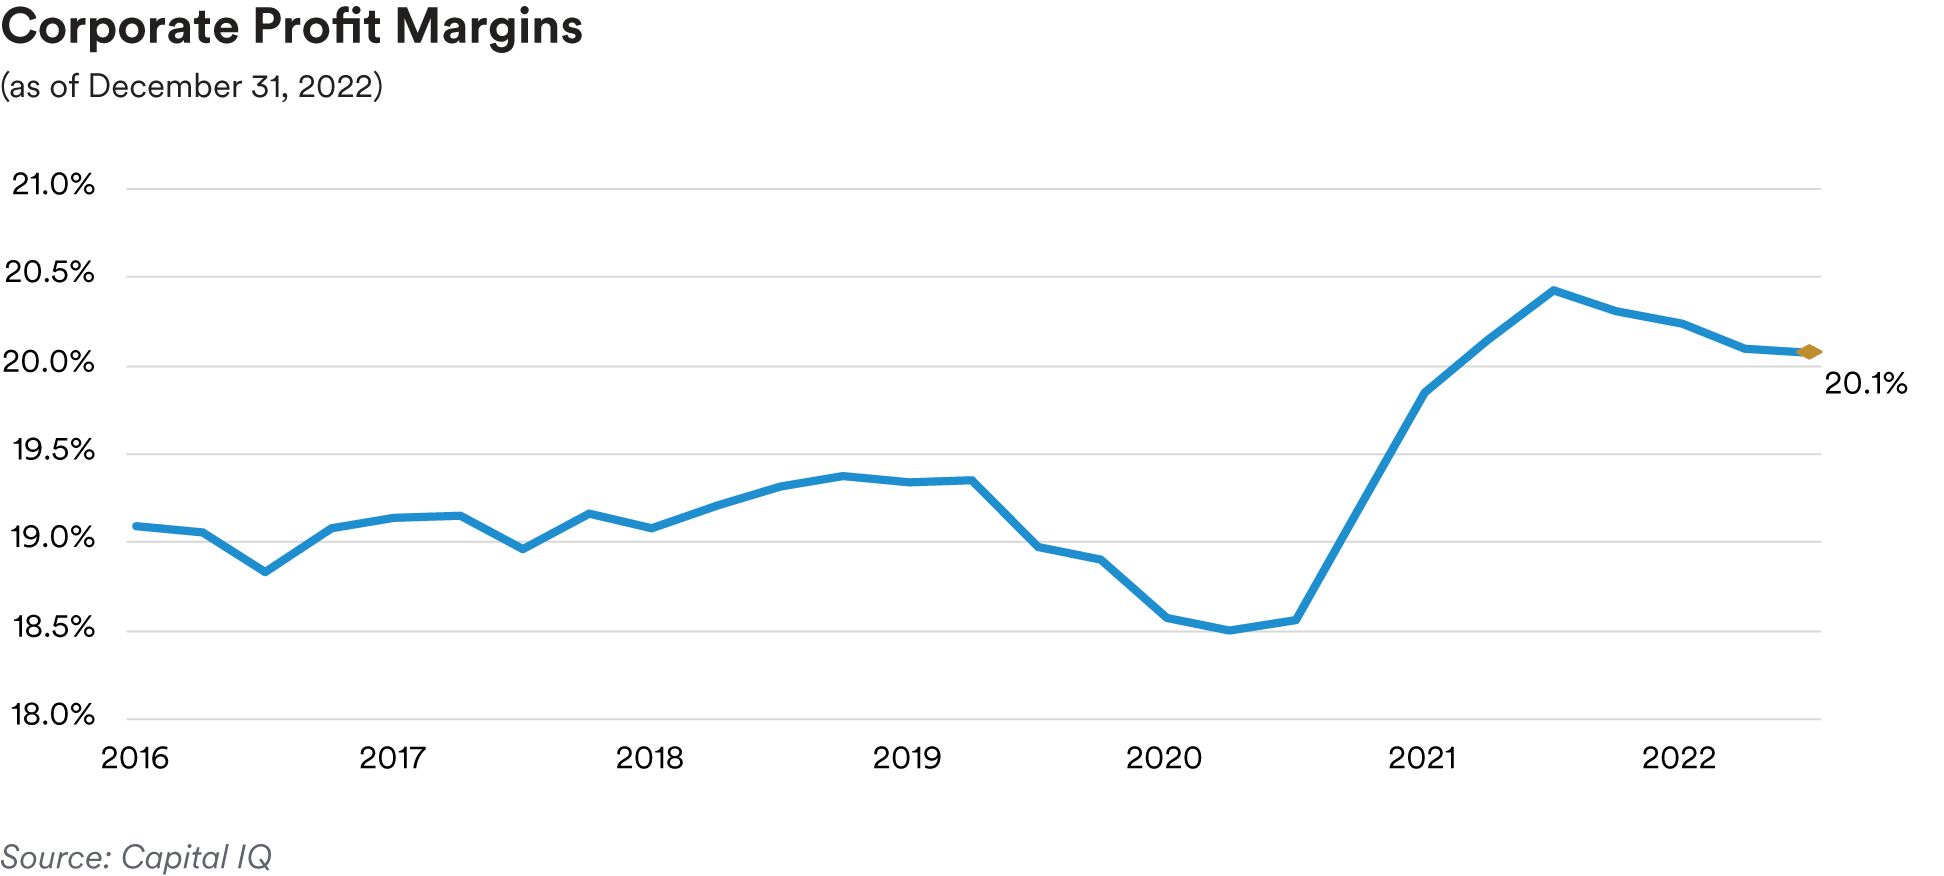
Turning to fundamentals, we also saw fourth-quarter earnings reports, which trickled in throughout the first quarter, show further deterioration with corporate earnings and operating margins across a number of subsectors declining on higher wages and input cost inflation while supply chain issues appear to have largely cleared up in many industries. For the S&P 500 Index’s constituent companies, fourth-quarter year-over-year EPS according to FactSet was -4.9%, the first decline since thirdquarter 2020. Bottom-line earnings looked especially weak when backing out Energy sector results as well as for those companies with higher exposures to non-U.S. revenues. We are closely watching the behavior of the U.S. consumer, which has shown some signs of weakening of late. Despite being helped by the decline in energy prices over the first quarter, consumer willingness to drive further meaningful growth in retail sales is in question after recent softness and possible favorable January buying activity skewed by mild winter weather. Also of note, FactSet tracks EPS guidance revisions for S&P 500 Index companies and noted that to date for soon-to-be-reported first-quarter earnings, the highest number of companies have issued negative earnings guidance since the third quarter of 2019, another indication that the economic environment may be weakening while we see tentative signs the labor market may also be slowing. With the lagged impact of the Federal Reserve’s monetary policy tightening program executed over the past year on economic growth and in other areas yet to be fully felt, we could be fast approaching an inflection point and see markets begin to price in a recession, which we believe will inevitably result in wider spreads.
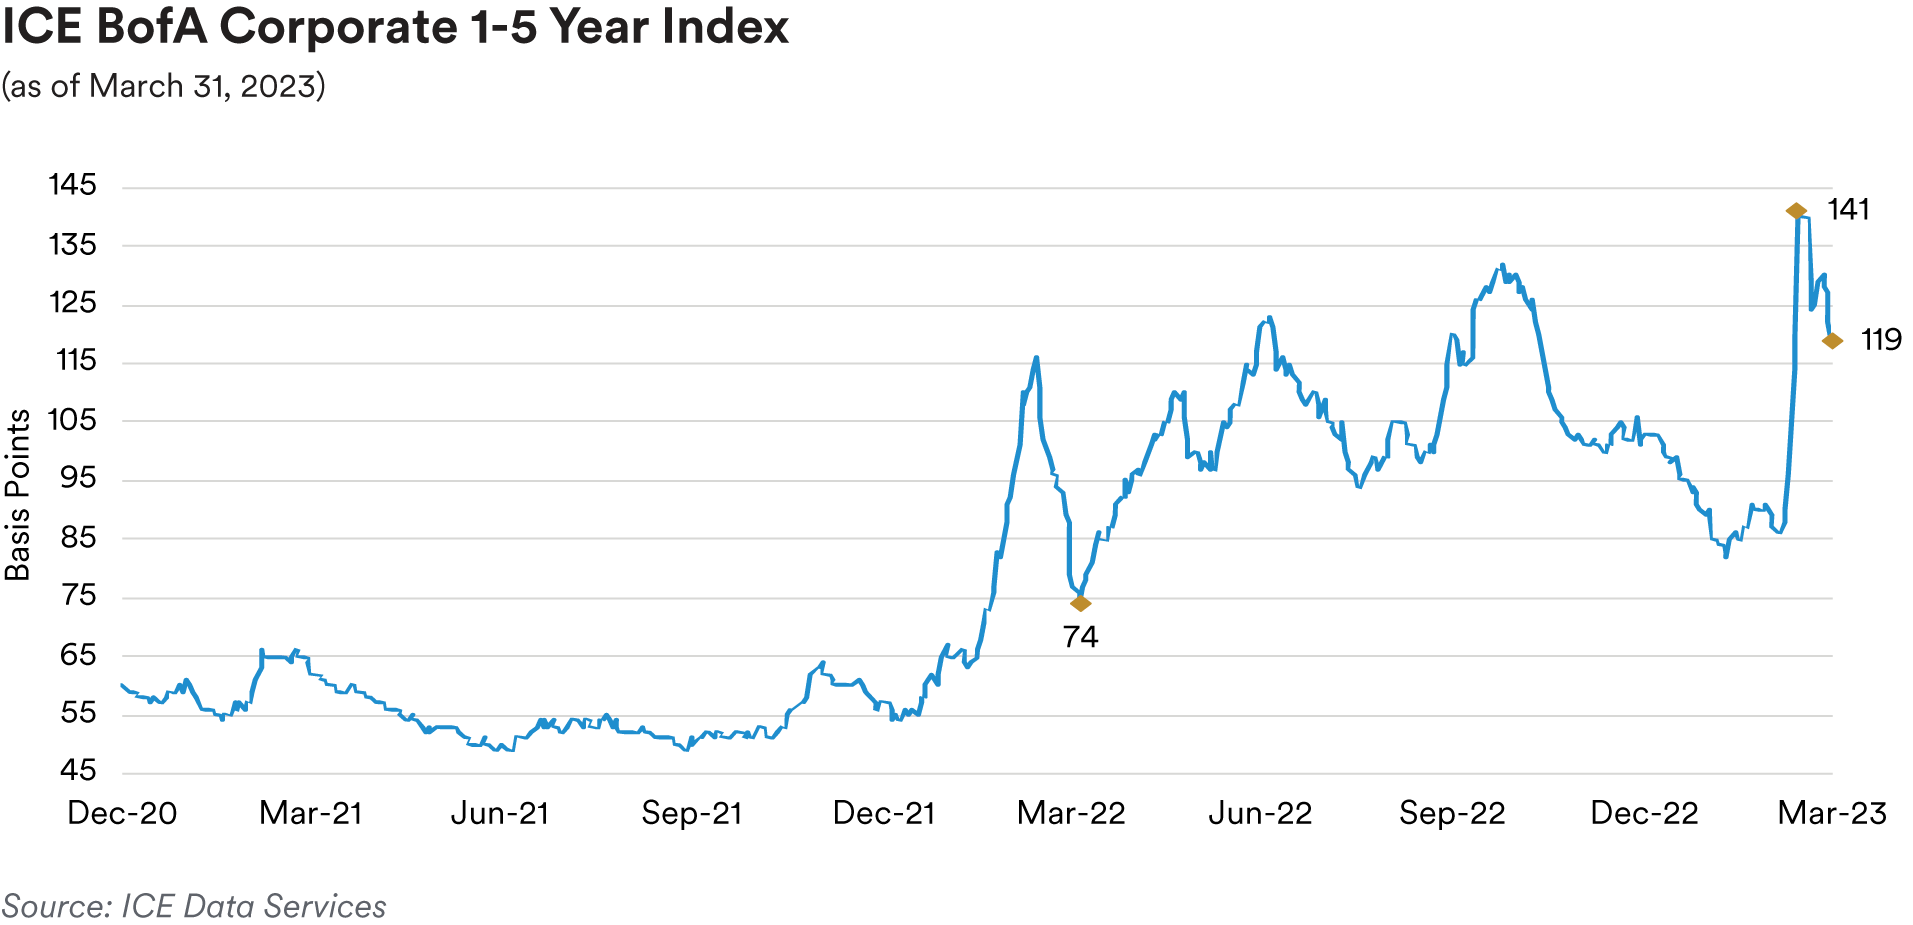
Portfolio Actions: The ICE BofA 1-5 Year U.S. Corporate Index, our bellwether front-end investment grade corporate index, closed the first quarter at an OAS of 119 basis points, 16 basis points wider vs. where the index began the quarter but 22 basis points tighter than the mid-March wide of 141 basis points. March’s substantial moves in Treasury yields and yield curve reshaping have left the corporate market, especially in the front end of the maturity spectrum, a bit dislocated entering the second quarter with some issuers’ credit spread curves uncharacteristically inverted. Having entered the first quarter with a more defensive positioning in investment grade credit relative to our historic norms across strategies, despite the reset wider in credit spreads, we continued to keep a close rein on our sector weightings and spread durations, even slightly reducing exposure over the quarter. This was notably evident in our 1-3 year and 1-5 year strategy portfolios, where we markedly increased our Treasury sector weightings. In our Cash Plus strategy, we partly replaced sector maturities by purchasing an 18-month technology sector new issue as well as adding several roughly one-year maturity secondary bonds at what we deemed attractive yields. In the Enhanced Cash strategy, we purchased the aforementioned 18-month technology sector new issue in addition to selectively adding mainly money center bank one-year duration bonds at attractive yields. We funded our purchases by selling mostly short-dated, fixed-rate 2023 maturity securities. In the 1-3 year strategy portfolios, we selectively added some two-year duration secondary bonds in a few of our favored names plus the 18-month technology sector new issue. We funded some of our purchases by selling some shorter-dated 2023 and 2024 maturity bonds as well as monetizing the meaningful spread tightening in a money center bank position acquired in the fourth quarter of last year. In the 1-5 year strategy portfolios, we selectively added a few new issues, including two-year and three-year maturity utility sector bonds and the 18-month technology sector bond. We trimmed our sector weighting by selling a few shorter-dated 2023 and 2024 maturity bonds as well as some less favored names more at risk of seeing their spreads widen due to weakening fundamentals, less favorable secondary market liquidity or heightened exposure to geopolitical concerns.
Outlook: In terms of our outlook for the investment grade credit sector, although March’s turmoil centering on issues in the banking sector pushed overall spreads to their widest level since last fall, we remain somewhat downbeat given the continuing deterioration in issuer credit fundamentals we observe and the market failing to adequately price in the building recession risks present in the current environment even after the reset higher in spreads. Analysts’ consensus estimate for corporate earnings growth for the S&P 500 Index for this year is actually slightly negative, indicative of the somewhat downcast outlook and the headwinds many companies face. Despite continued surprising resilience in the labor market, other recent economic indicators like PMI and ISM data have started to deteriorate and could be a sign that the cycle is about to end as the U.S. economy may flirt with a recession later this year. Consumer spending is also showing tentative signs of slowing after a period of pandemic-driven strength. The opportunity for the Federal Reserve to orchestrate a soft landing may also be closing quickly with their progress on tackling inflation probably not as far along as they would have hoped, necessitating at least one further rate hike to help finish the job at the same time that financial conditions are otherwise tightening, exacerbated by the recent problems in the banking sector, which we believe will hamper bank lending. We are also wary of seeing additional messy unwinds and market turbulence stemming from our emergence from a prolonged period of low interest rates. Another factor supporting our cautious stance is the move lower in all-in yields which has reduced the attractiveness of the investment grade sector at the same time risks have grown.
We expect to continue to hold a lowered credit sector weighting and reduced risk positioning across our strategies compared to our historical norms given our extremely guarded outlook. Succinctly, we do not believe that the risks and heightened uncertainties in the current environment are sufficiently reflected in credit spreads, which we see as biased to widen, perhaps significantly in the event of a hard landing or recession that most market participants seem to discount or underestimate. Until fundamentals or our outlook turn more positive, we will remain patient and selective, content to maintain a more defensive, up-in-quality positioning and favor more defensive subsectors like Communications, Consumer Non-cyclicals, and Electric Utilities better situated to avoid or see more limited spread widening relative to other subsectors more impacted by a downturn. In this cycle, many companies will likely enter the eventual slowdown with stronger balance sheets relative to prior cycles but will not necessarily be able to avert the credit rating downgrades a recession inevitably brings. In the meantime, we will remain very selective in picking our spots in credit, focusing on periodically taking advantage of market dislocations or one-off opportunities.
Performance: For the first quarter, the investment grade credit sector was an uneven contributor to relative performance across strategies with slightly positive excess returns in our shorter dated strategies and modestly negative excess returns in some of our longer dated strategy portfolios. As noted above, credit spreads ratcheted tighter over the first half of the quarter before fading in the latter part of February then gapping out nearly 50 basis points in March in the wake of the Silicon Valley Bank failure and noise around Credit Suisse before retracing some of the March spread widening at quarter end. The OAS of our front-end benchmark 1-5 year U.S. corporate index rose on a quarter-over-quarter basis, causing the index to post its worst excess return since first-quarter 2020. Positive technicals in terms of strong investor inflows into investment grade corporates and attractive all-in yields helped the market readily absorb January and February’s healthy new issue calendar. However, the market darkened in March as problems in the Banking sector came to the fore and produced a strong risk-off shift. Across our strategies, strongly performing investment grade credit subsectors driving positive excess returns included Insurance, Health Care and Automotive. As we have outlined previously, over prior quarters we materially reduced our exposure across strategies and remain underweight to Yankee banks and U.S. regional banks, which bore the brunt of March’s spread widening. However, our Banking sector holdings produced slightly negative excess returns for the quarter outside of our shortest Cash Plus strategy.
Treasuries / Agencies
Recap: The first quarter of the year was defined by higher interest rate volatility and a lack of conviction as an undoubtedly bullish start to the year in Treasuries pushed the five-year yield to 3.40% and the ten-year yield to 3.30% by mid-January. However, a stronger-than-expected employment report in early February triggered a renewed hawkish repricing that pushed rates higher and the yield curve deeper into inverted territory. The two-year Treasury yield reached as high as 5.08% and the ten-year yield as high as 4.09% before plummeting to lows of 3.55% and 3.28% respectively, in the wake of the risk-off move in the financial sector that seemed to define March.
-Index-1Q-2023.png)
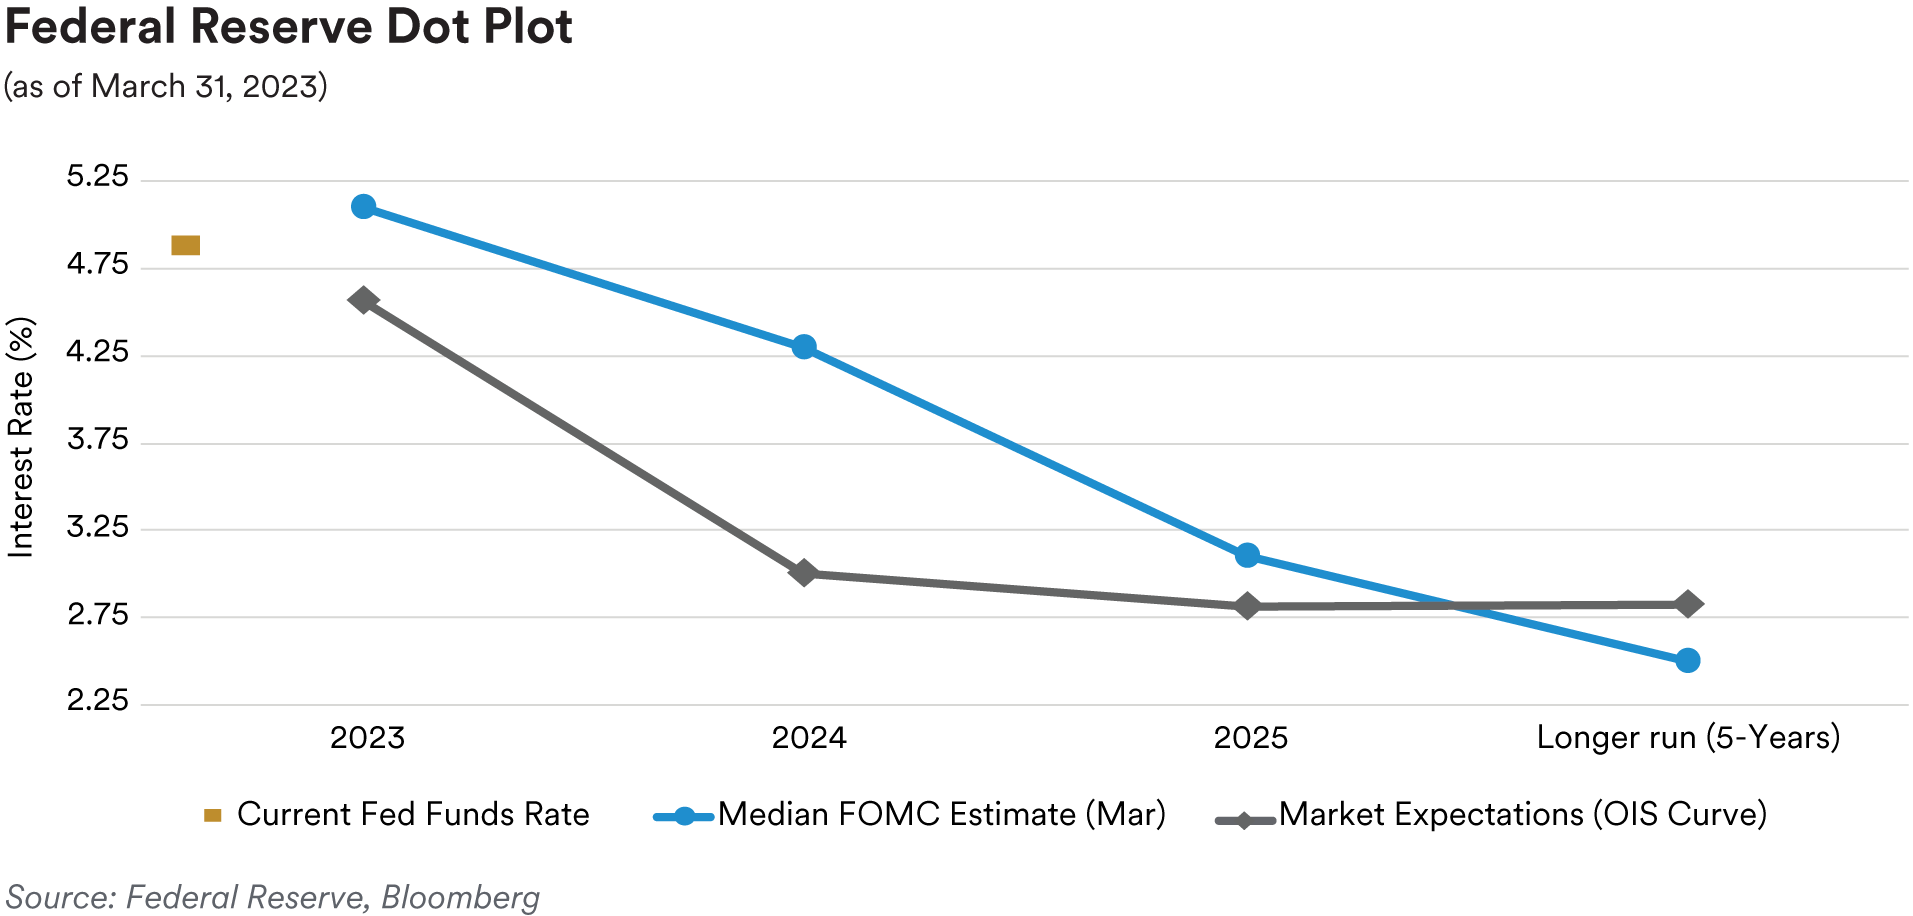
The Federal Reserve delivered two 25-basis point hikes in February and March, bringing the target band to 4.75% to 5.00%. The most important takeaway from the March FOMC statement was the shift away from “ongoing increases” to the policy rate to “some additional firming” may be necessary. The 2023 median federal-funds rate “dot plot” was left unchanged at 5.125% (i.e., 25 basis points of additional tightening to reach the terminal rate). We also saw the year-end 2024 dot plot estimate increase from 4.125% to 4.25%, pointing to a reduction in the amount of easing the Federal Reserve anticipates. The market’s expectation of the fed-funds rate at the end of 2023 went from 4.58% at the start of the quarter to a high of 5.56% in early March before ending the quarter at 4.33%. The great uncertainty around the Fed hiking cycle led to a spike in front-end volatility with some parts of the volatility surface reaching levels not seen since the global financial crisis in 2008. Average daily basis point moves priced into the front end of the Treasury market moved from close to 9 basis points per day early in the quarter to over 13 basis points per day in mid-March, before closing the quarter at 10 basis points per day. Treasury market liquidity initially declined as volatility increased in mid-March but slowly improved towards the end of the quarter as daily volatility declined slightly as mentioned.
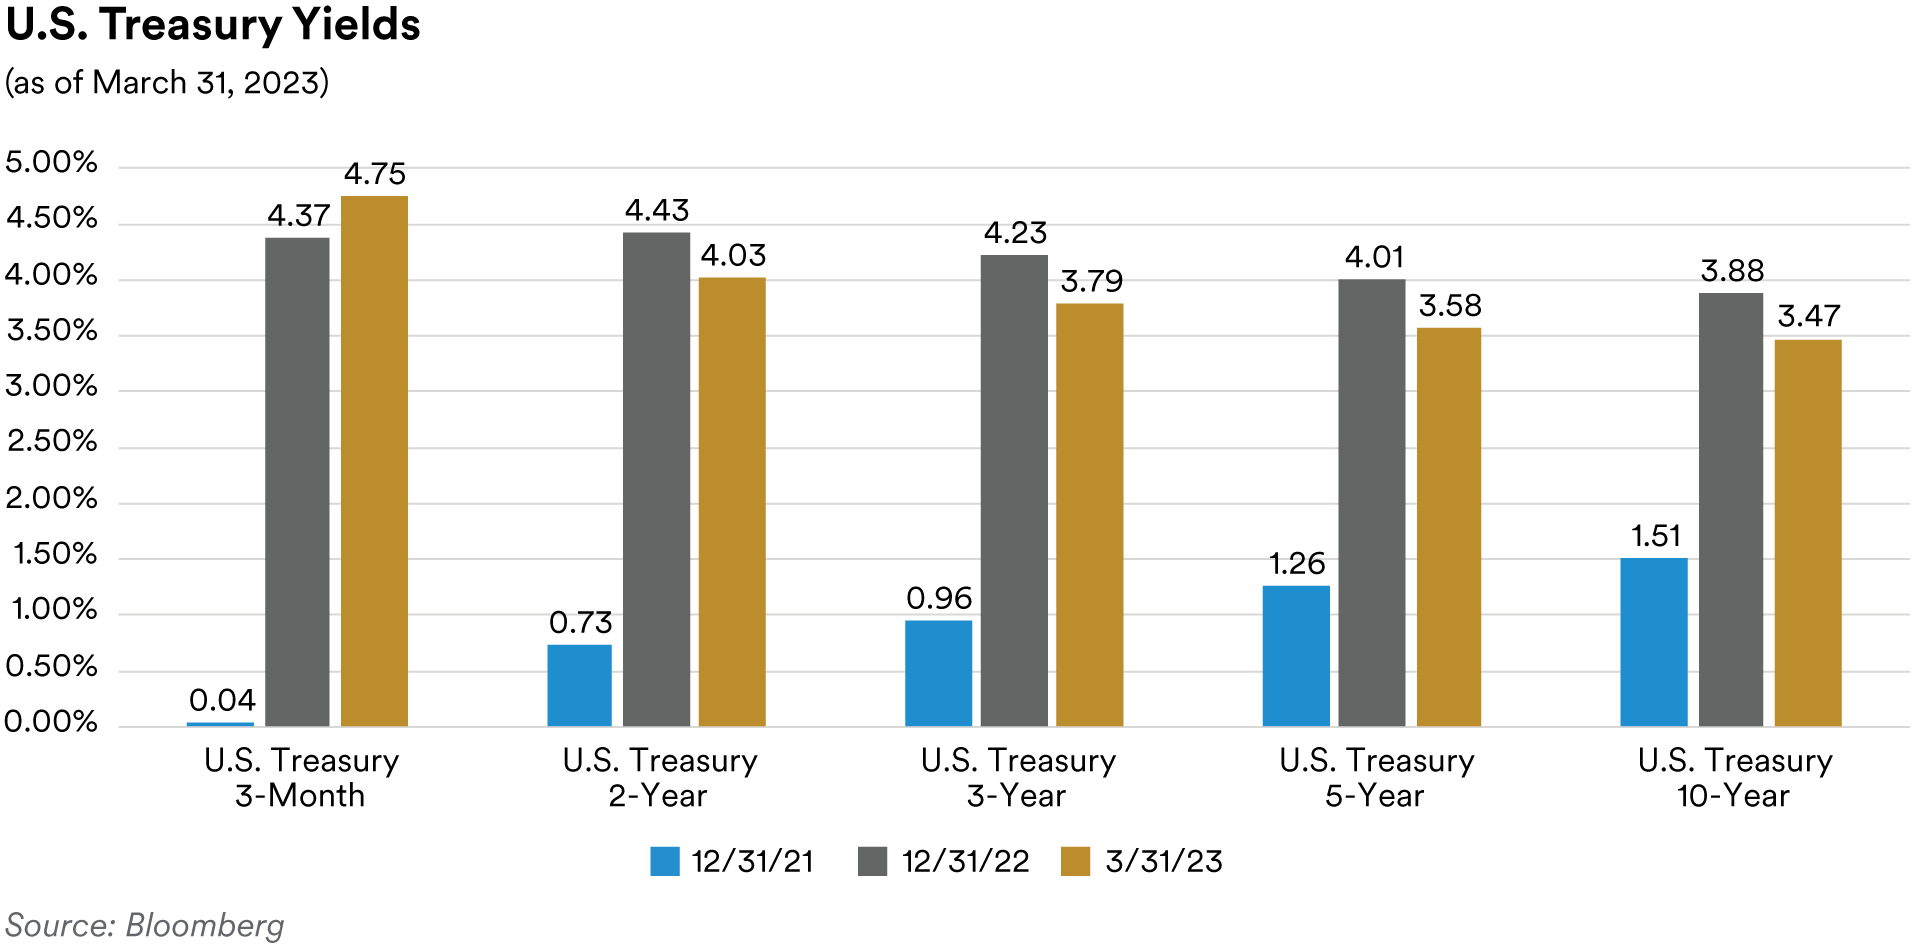
The very front end of the market sold off in the first quarter as short rates responded to the Federal Reserve continuing to move the funds rate higher. The three-month and six-month Treasury bill yields were 35 basis points and 10 basis points higher during the quarter respectively, whereas the one-year Treasury bill moved 10 basis points lower. The two-year Treasury, which traded in a 153-basis point range during the quarter, moved 40 basis points lower, closing the quarter at 4.03%. The five-year Treasury rallied 43 basis points and ended the quarter at 3.58% while the tenyear Treasury moved 41 basis points lower to finish the quarter at 3.47%. The yield curve reached its flattest levels at the beginning of March before steepening into the end of the quarter, ending essentially unchanged. The spread between the ten-year Treasury and the two-year Treasury moved from -55 basis points at the start of the quarter to as flat as -110 basis points in early March before closing the quarter at -56 basis points. The spread between the five-year Treasury and twoyear Treasury moved from -43 basis points at the start of the quarter to -78 basis points in early March before concluding the quarter at -45 basis points while the big move was seen in the spread between the five-year Treasury and three-month Treasury which moved from -40 basis points at the start of the quarter to -123 basis points at the end of the quarter.
Treasury Inflation-Protected Securities (“TIPS”) breakeven inflation rates moved higher from midJanuary to early March as nominal Treasury yields moved higher. However, after peaking in early March, recession fears post the regional banking crisis led to a decline in inflation breakeven rates over the balance of the quarter, although breakevens still ended the quarter higher. Five-year TIPS breakeven rates went from 238 basis points at the start of the quarter to 248 basis points at the end of the quarter (after peaking at 280 basis points); ten-year TIPS went from 230 basis points to 232 basis points in the same period (after peaking at 254 basis points). With TIPS breakeven rates moving slightly higher, real yields (yield adjusted for inflation expectations) moved lower during the quarter. The five-year real yield moved from 165 basis points to start the quarter to 117 basis points to end the quarter while the ten-year real yield went from 158 basis points to 115 basis points during the same period.
Front-end Government-Sponsored Enterprise (GSE) agency spreads moved marginally wider over the first quarter as the option-adjusted spread (OAS) of the ICE BofA 1-5 Year U.S. Bullet (fixed maturity) Agency Index ended the quarter at 10 basis points, 2 basis points wider from the start of the year. In the SSA subsector, U.S. dollar-denominated fixed-maturity security spreads were unchanged and finished the first quarter, on average, at 30 basis points over comparable-maturity Treasuries. Agency callable spreads widened to multiyear wide levels relative to Treasuries as short-dated and short-expiry volatility in the upper left portion of the volatility surface spiked significantly in March coincident with the unfolding of the stress in the banking sector. Over the quarter, two- and three-year maturity “Bermudan” callables which feature quarterly calls with lockouts of three months were offered at spreads over Treasuries of 150 and 190 basis points, respectively. The banking episode that occurred in March required large liquidity injections into the banking system. During this period, the Federal Reserve, and the Federal Home Loan Bank system (FHLB) stepped in to bolster bank liquidity. In addition to access to the discount window, the Fed created a new Bank Term Funding Program (BTFP) that offers loans of up to one year to eligible depository institutions that pledge Treasuries, Agency debt, mortgage-backed securities (MBS) and other qualifying assets as collateral. FHLB is known as a “lender of next-to-last resort” for banks – a play on the nickname for the Fed’s discount window. FHLB was a key source of cash for regional banks during March as they were able to obtain collateralized loans known as advances, which are available to the system’s member banks. There were single days where total debt issuance was greater than $110 billion, leading to the biggest-ever days of financing for FHLB. For context, at the end of 2022, the 11 FHLBs had $823 billion in total outstanding advances.
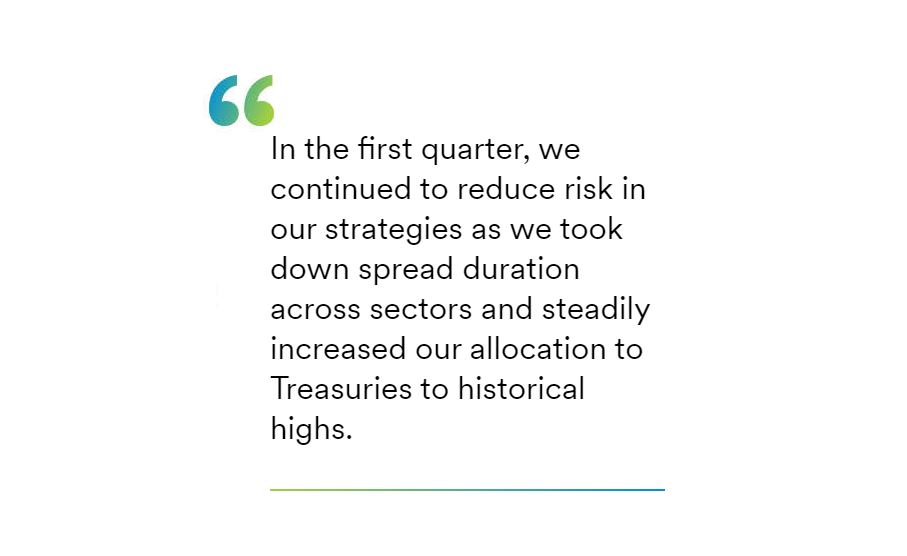
Portfolio Actions: In the first quarter, we continued to reduce risk appetite in our strategies as we took down spread duration across sectors and steadily increased our allocation to Treasuries to historical highs. We opportunistically bought nominal Treasuries to add duration, targeting points on the curve with maturities of longer than one year across portfolios. More notably, we added to the Fed-policy-sensitive two-year Treasury on March 8 as yields peaked at 5.08% when the Treasury market sold off due to the disappointing results of a ten-year Treasury auction. As Agency callable spreads widened, we also took the opportunity to increase our allocation to callables across our shorter dated strategies over the quarter at what we considered to be attractive levels.
Outlook: As we start the second quarter, there is much uncertainty around the future path of the federal-funds rate. While Fed officials continue to call for no easing anytime soon, the market is starting to aggressively price in future rate cuts by early fall, which is less likely to happen in our view. While economic data is starting to show signs of growth slowing down, inflation remains at stubbornly elevated levels. Although we may have seen the highs in interest-rate volatility, we believe it will remain elevated but range-bound, leaving callable Agencies continuing to look attractive. There is some risk of widening for SSA and GSE spreads, however, as they are likely to take their cues from overall risk sentiment. From a duration standpoint, the front end of the yield curve may reflect a market that is overly optimistic regarding future rate cuts, and our bias is for higher yields in the near term. Nevertheless, we believe the peak in front-end yields may have already been reached for this cycle. We continue to look for opportunities to adjust duration across our portfolios as Treasury yields reach our defined technical support levels. In addition, as the Federal Reserve is near the end of its tightening cycle, we have begun to work on a yield curve steepener posture and would look to construct the portfolios to have more of a bulleted posture across various points on the curve.
We expect the market’s attention will circle back around to the debt ceiling as tax receipts roll in and offer more clarity on the actual “X date,” when the U.S. Treasury exhausts its extraordinary measures, threatening a default. As of now, the date is still a moving target within a range between mid-June (according to the Treasury’s estimate) and early fall. House Speaker McCarthy has stated that he is “very concerned” a debt ceiling deal will not be reached with President Biden and blamed the lack of progress on Biden’s unwillingness to meet and negotiate a deal. Biden has been adamant that Congress must past a clean debt ceiling bill without spending cuts, noting that Congress did so three times under former President Trump. As yields on Treasuries have risen, so too have the government’s borrowing costs and consequently raise the cost of servicing the nation’s debt. In February, the Congressional Budget Office (CBO) projected that annual net interest costs would total $640 billion in 2023 and double over the upcoming decade, rising from $739 billion in 2024 to $1.4 trillion in 2033 and aggregating $10.5 trillion over that period. To put it in perspective, the cost of interest payments on the national debt is set to exceed defense spending by 2025. The updated CBO projections have heightened a partisan divide between President Biden and Republicans over taxes, spending and the debt limit. We will monitor the Treasury-bill market, which tends to be the first area to show signs of stress when the Treasury is expected to run out of extraordinary measures and become unable to meet its obligations. Usually, kinks in the Treasury-bill curve will develop around the X date as investors narrow down possible dates when a default may be likely. We think the debt ceiling issue will ultimately be resolved but not without additional rate volatility, especially in the very front end of the maturity spectrum where we operate.

Performance: Our slightly short to neutral duration posture was additive to excess returns across most strategies except for our Cash Plus strategy where duration was a detractor but was largely offset by our yield curve positioning. Our marginal barbell-biased yield curve positioning relative to benchmark indices in our 1-3 year, 1-5 year and intermediate strategies was a negative contributor to excess returns. In our shorter Cash Plus and Enhanced Cash strategies, our yield curve positioning was a substantial contributor as indices in these strategies are very bulleted. We note that any underperformance from our yield curve strategy was more than offset by the outperformance from duration in our 1-5 year and intermediate strategies. The Agency sector saw modestly negative excess returns in our shorter strategies, which hold a higher allocation to Agency callables as volatility spiked during the quarter, driving the underperformance of those securities.
ABS
Recap: ABS spreads ended the first quarter mixed as macro volatility returned to the market following the FDIC’s seizure of Silicon Valley Bank and Signature Bank and the forced sale of Credit Suisse to UBS. Spreads began the quarter by tightening dramatically in January, were generally range-bound throughout February and then widened following the events in March. Overall, spreads on three-year, fixed-rate AAA-rated prime and subprime auto tranches ended the quarter at 85 basis points and 110 basis points over Treasuries, respectively, giving back all the tightening seen in January and ending the quarter close to unchanged on spread. In contrast, three-year, floating-rate private student loan tranches were flat, ending the quarter at a spread of 160 basis points over SOFR, and three-year fixed-rate AAA-rated credit cards ended the quarter at a spread of 77 basis points over Treasuries, 31 basis points wider. The relative underperformance of credit card tranches can be attributed to investors seeking to raise cash in a volatile market by selling the most liquid ABS asset. First-quarter ABS new issuance volume in the first quarter was 12% lower than last year with almost $60 billion of new deals coming to the market, compared to over $67 billion in the first quarter of 2022. As usual, the auto subsector dominated new issuance with $36 billion of new deals. This volume actually exceeded the over $31 billion seen in the first quarter of 2022 (autos were the only subsector to show greater issuance volume compared to last year’s first quarter). Following autos were the “other ABS” subsector (a “catch-all” category which includes deals collateralized by cell phone payment plans, timeshares, mortgage servicer advances, insurance premiums, aircraft leases, etc.) with over $13 billion of new issuance and the equipment subsector with over $5 billion of new issuance. In comparison, in the first quarter last year, “other ABS” and equipment priced $16 billion and $7 billion of new deals, respectively.
The industry held its annual “ABS West” conference in Las Vegas in late February. The conference saw high turnout and even with the conference predating March’s market volatility, most participants expressed a cautious mood. Investors’ main concerns were the challenges the Fed faces in achieving a soft landing while constraining inflation and rising geopolitical friction with China. Most attendees expected continued deterioration in consumer asset backed credit metrics, particularly for subprime borrowers. However, the consensus was that ABS bonds generally have sufficient enhancement to weather the coming downturn. Certain smaller subprime auto issuers may struggle in this environment, and some participants predicted industry consolidation as the likely outcome.
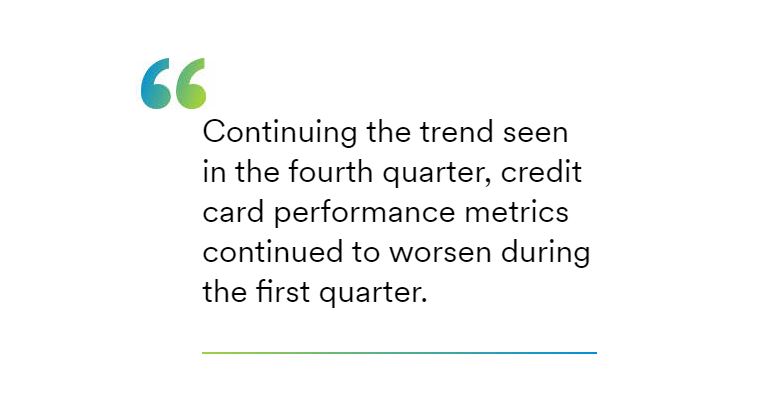
Continuing the trend seen in the fourth quarter, credit card performance metrics continued to worsen during the first quarter. Data from JP Morgan credit card performance indices reflecting the March remittance reporting period showed charge-offs and 60+-day delinquencies on bank credit card master trusts rising 21 basis points and 13 basis points, respectively, to 1.40% and 0.78%, over the quarter. Charge-offs and delinquencies on bank master trusts have been slowly moving higher but are still well below historic averages. In our view, credit card metrics are likely to continue to erode given a more challenging labor market, rising consumer debt levels, inflationary pressures, and a shrinking pool of savings. However, ABS trusts’ performance will likely outperform their related bank managed credit card portfolios as they tend to have much more seasoning due to the lack of new accounts being added to the trusts. For example, in comparison to the 1.40% charge-off rate seen in the latest ABS trust reports, the charge-off rate for all commercial bank credit card portfolios was 2.55% (as of the fourth quarter of 2022). According to the Federal Reserve, revolving debt outstanding increased 15.6% year-over-year through January to $1.21 trillion dollars. In our view, rising revolving debt levels reflect increased consumer spending, lower savings rates, and the expiration of pandemic-related stimulus programs.
New vehicle sales enjoyed a strong quarter as better inventory levels and improved fleet sales buoyed volumes. January’s print was strong at a 15.7 million SAAR (seasonally-adjusted annual rate) followed by February and March SAAR prints of 14.9 million and 14.8 million, respectively. March’s number reflected an 11% increase compared to last year. Commenting on the strong sales numbers, Cox Automotive noted that while the average loan rate for a new vehicle is now near 9% and list prices are above $47,000, consumers continue to buy new cars at a healthy clip, with almost all automakers reporting first-quarter sales volumes higher than last year and several reporting record volume. Used vehicle prices, as measured by the Manheim Used Vehicle Index, also rebounded over the first quarter, after falling for most of last year. The index came in at 238.1 in March, up 1.5% relative to February and 8.6% since the start of the year, but despite the increases this quarter, used car prices are still down 2.4% from year-ago levels. Manheim estimated that used car supply ended March near 38 days of supply, down from 43 days in February. Falling supply typically pushes dealers into the wholesale auction lanes to restock, which is supportive for used car prices.
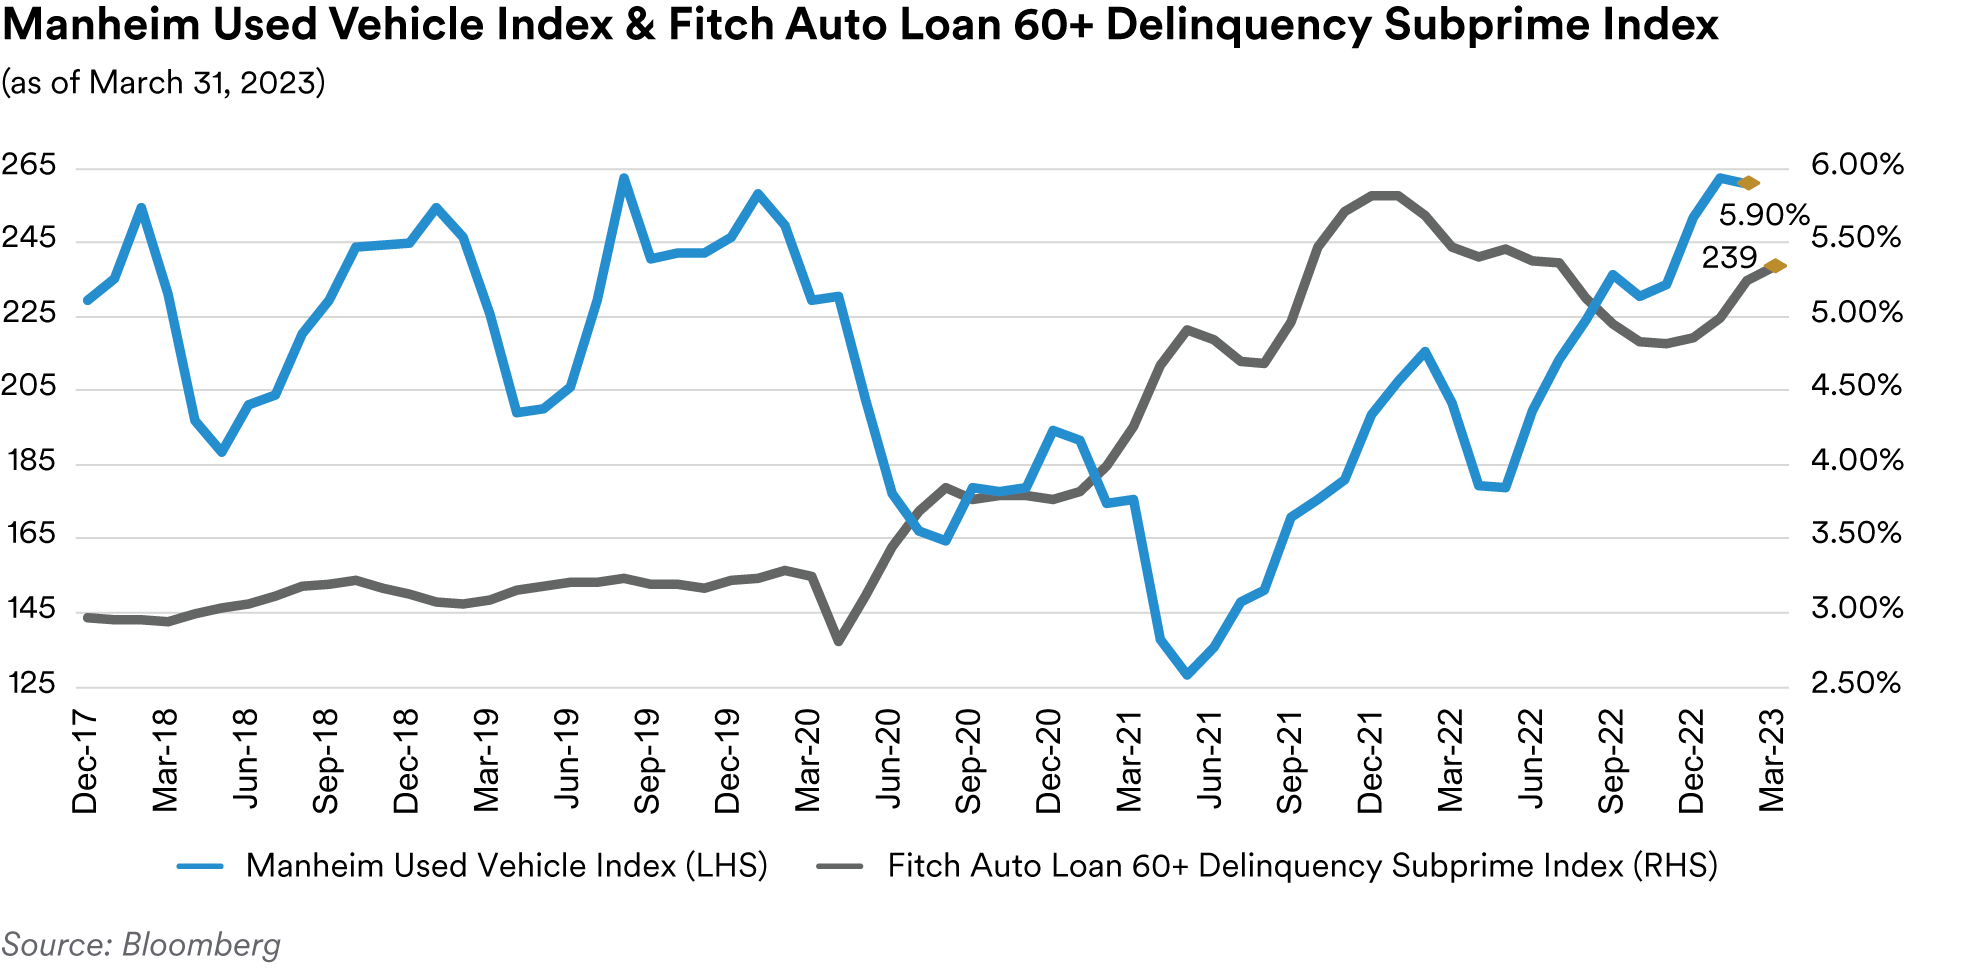
Despite the rebound in used car prices, rising interest rates and inflationary pressures continue to degrade auto ABS performance metrics. As of February’s data, the 60+-day delinquency rates on the Fitch Auto ABS indices were 0.32% for the prime index and 5.90% for the subprime index, 8 basis points and 113 basis points higher than year-ago levels, respectively. Similarly, annualized net-loss rates for the indices stand at 0.44% for the prime index and 8.66% for the subprime index, reflecting year-over-year increases of 19 basis points and 269 basis points, respectively. As we have noted in previous commentaries, we believe the bifurcation between the prime and subprime indices reflects the fact that prime borrowers are better able to weather the current worsening economic conditions than subprime borrowers. Going forward, we remain quite comfortable with our holdings of AAA and AA-rated auto tranches as, in our opinion, these deals have more than ample credit enhancement to protect senior bondholders from eroding credit performance.
Portfolio Actions: Over the course of the first quarter, we materially increased our ABS exposure in our shortest duration strategies while either reducing or maintaining our exposure in our other strategies. In our shorter strategies, the increase in exposure involved our continued purchase of front-pay auto ABS “CP” tranches. These tranches stand at the top of the payment waterfall and carry short-term commercial paper ratings equivalent to AAA. In essence, since they are structured to receive the first principal payments from the deal, they are the safest tranches in ABS deal structures from a credit perspective. In addition, we purchased one-year average life AAA-rated senior tranches in various auto and equipment deals. In addition to having the benefit of a favorable liquidity profile due to their very short average lives, these tranches at present benefit from the inverted yield curve and often offer higher yields than longer tenor alternatives. Our purchases occurred in both the primary new issue and secondary markets. For example, in late March we purchased a new issue, 0.3-year P-1/F-1+ (“AAA”) rated ABS CP tranche of an equipment deal at a spread of 42 basis points over Treasuries and a 0.2-year, A-1+/F1+ (“AAA”) rated ABS CP tranche from a prime auto deal at a spread of 40 basis points over Treasuries.
Outlook: Given the current volatility in the market and our continued expectation that economic conditions are likely to worsen for consumers going forward, we are content to maintain our current defensive strategy and focus on enhancing portfolio liquidity. We believe that short-tenor auto and equipment tranches still offer good value compared to alternatives and are a natural fit for our strategies. We are biased to favor prime auto tranches over subprime, but we remain comfortable adding subprime exposure to deals from a selective group of issuers that have a demonstrated history of operating through credit cycles and have short maturities. With credit card spreads widening in March, we may look to increase our exposure in that subsector, particularly in our longer strategies where two-year to three-year holdings are a better fit. We continue to avoid adding to our CLO holdings given our expectations for headwinds in the leveraged loan market.
Performance: Our ABS holdings produced mixed results across our portfolios in the first quarter. After adjusting for their duration and yield curve positioning, ABS produced negative excess returns in our shortest duration strategies and positive excess returns in our longer strategies. The divergence stemmed from the relative higher weighting in auto tranches in our shorter strategies and private student loan tranches in our longer strategies. While most of our holdings performed well early in the quarter and poorly in March, our student loan tranches (which was our worst performing ABS subsector last year) held on to more of their early-quarter gains in March compared to our auto tranches, and so were positive net contributors over the entire quarter. Our CLO holdings were slightly negative across all strategies with the exception of our 1-5 Year strategy, where we do not have exposure to that subsector.
CMBS
Recap: Compared to like-duration Treasuries, short tenor CMBS spreads moved wider over the first quarter due to concerns about the outlook for office properties and market volatility related to the failures of Silicon Valley Bank and Signature Bank. At the end of the quarter, spreads on threeyear AAA-rated conduit tranches stood at 152 basis points over Treasuries (27 basis points wider) and spreads on five-year AAA-rated conduit tranches stood at 158 basis points over Treasuries (30 basis points wider). With interest rates higher, office properties in the headlines and concerns about the health of bank commercial real estate portfolios setting a negative tone, only $35 billion of new issue CMBS came to market in the first quarter, a decline of over 60% when compared to 2022’s first quarter, which saw over $89 billion of new deals print. Continuing the trend that began last year, the greatest decline in volume came from the non-agency sector, which had only $7 billion of new issuance this quarter, compared to $44 billion in the first quarter last year, amounting to a more than 85% drop in volume. In comparison, agency CMBS declined only 39% compared to last year with $28 billion of new agency deals pricing in the first quarter, compared to $46 billion last year.
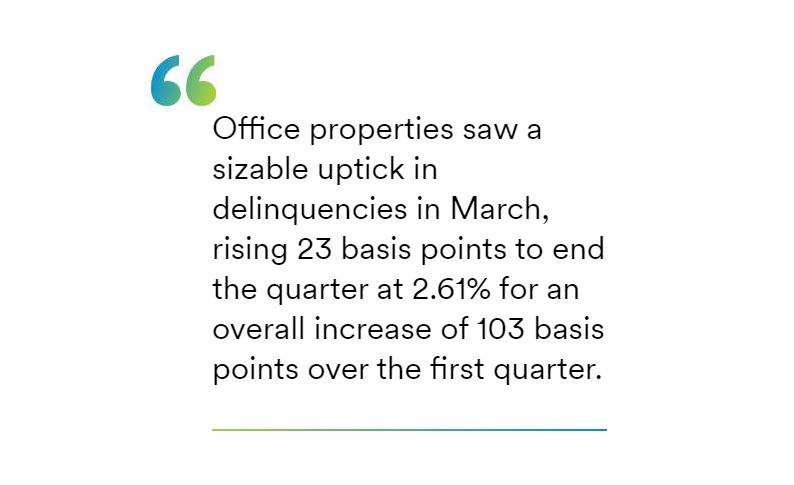
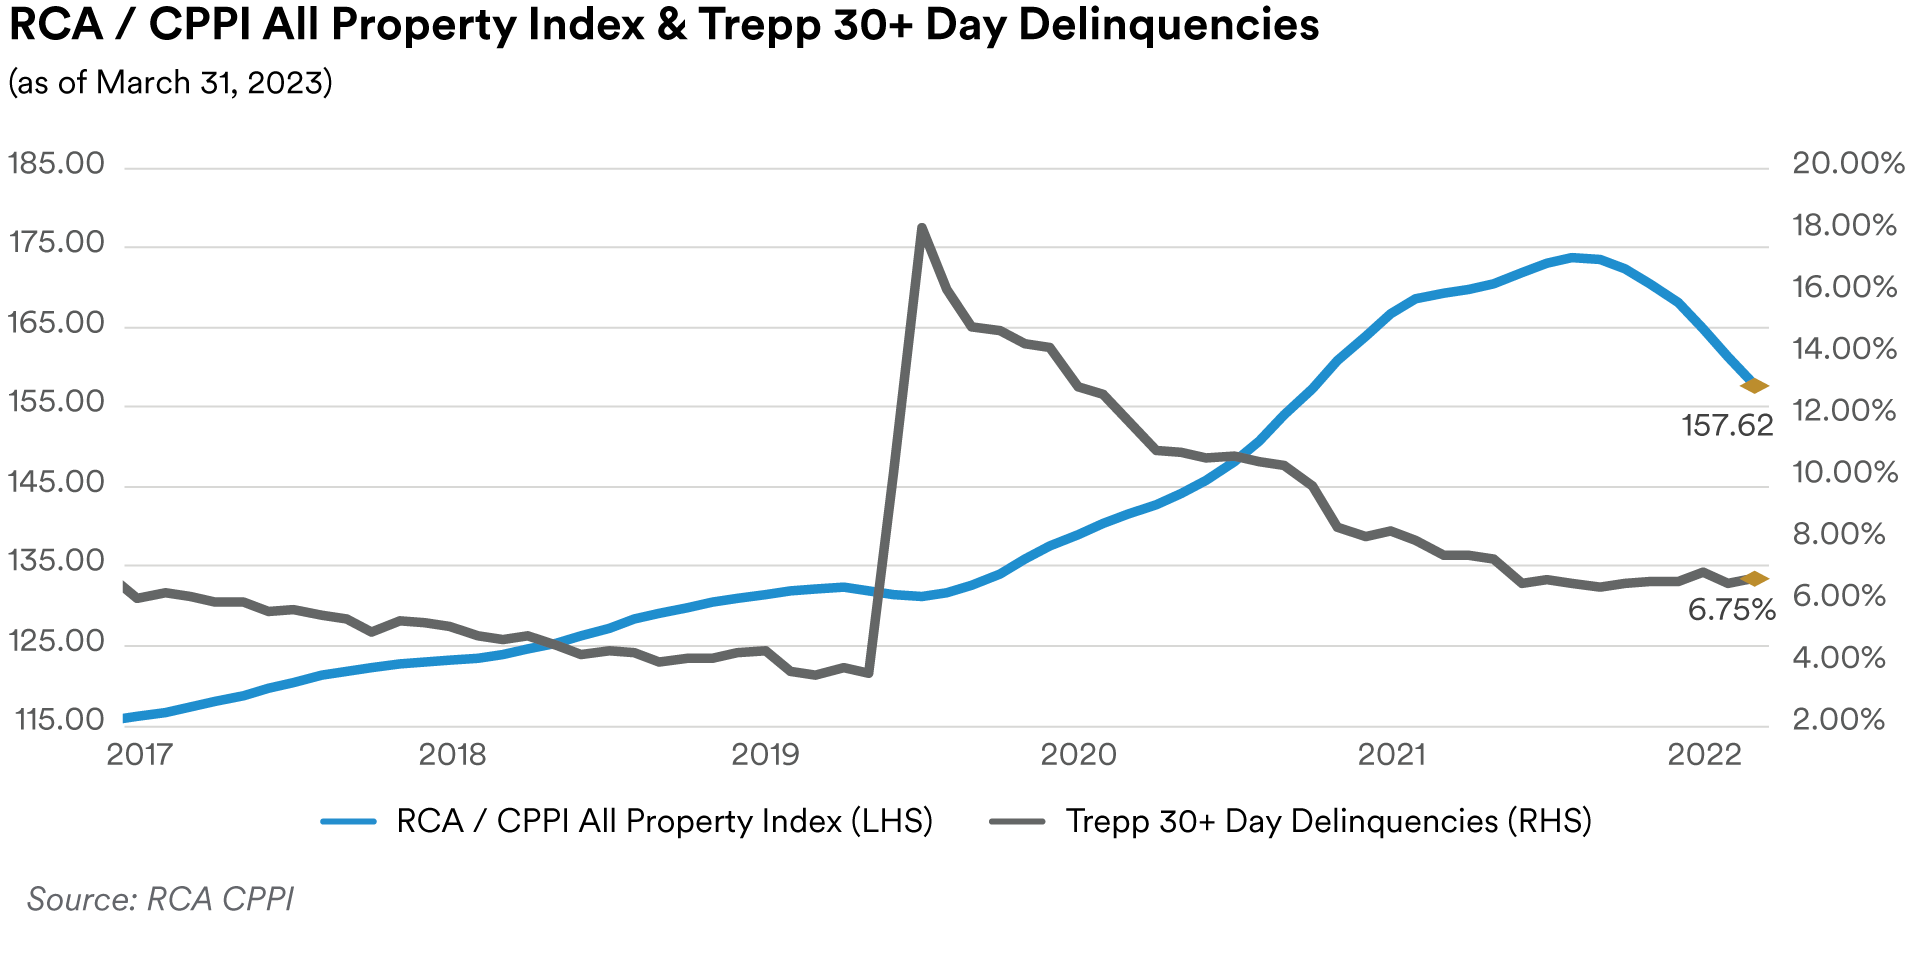
Much like in the fourth quarter last year, CMBS delinquencies increased slightly over the quarter. As measured by the Trepp 30+-day delinquency rate, CMBS delinquencies ended the quarter at 3.09%, reflecting a drop of 3 basis points for March but an overall increase of 5 basis points for the quarter. Year over year, the overall delinquency rate has fallen 64 basis points. Despite the drop in the headline rate in March, Trepp noted that office properties saw a sizable uptick in delinquencies in March, rising 23 basis points to end the quarter at 2.61% for an overall increase of 103 basis points over the first quarter. The industrial and multifamily subsectors remain the best performing with delinquencies of 0.37% (5 basis points lower on the quarter) and 1.91% (26 basis points lower on the quarter), respectively. Retail and lodging remained the worst performing subsectors with delinquencies of 6.23% (74 basis points lower on the quarter) and 4.41% (1 basis point higher on the quarter), respectively.
Commercial property prices continued to fall over the quarter as measured by the RCA CPPI National All-Property Composite Index. The downturn began in January when RCA’s data (released in its February report) showed prices down 2.7% for the month and 4.8% year-over-year led by weakness in apartment properties. RCA noted that the spike in mortgage costs last year has hampered commercial property deal activity and pushed prices lower. The March release of the index showed prices fell another 2.2% in February to 157.6 and the annualized growth rate is now negative at -6.9%. As in January, weakness in apartments drove the decline. Apartment prices have now fallen 8.7% from year-ago levels, the largest annual price drop for that sector since 2010. Away from apartments, prices also fell in all of the other subsectors in the first quarter except for industrial properties, which showed gains with prices in that subsector rising 3.6% year-over-year. Retail property prices fell 1% in February and are down 2.2% year-over-year while office properties saw prices drop 0.6% in February and, like retail properties, are now down 2.2% year-over-year.
The most recent Fed Senior Loan Officer Opinion Survey, reflecting sentiment as of the fourth quarter of last year, showed banks reporting tighter standards and weaker demand for all commercial real estate (“CRE”) loan categories. The survey also included a set of special questions regarding banks’ expectations for changes in lending standards, loan demand and loan performance for 2023. Most respondents anticipate tightening lending standards for all types of CRE loans in 2023 and expect to see weaker loan demand and deteriorating credit performance. Historically, tightening standards for CRE loans precedes periods of rising delinquencies and charge-offs.
In market news, on April 3rd the FDIC announced its intention to sell the $60 billion CRE portfolio it acquired following the failure of Signature Bank. The FDIC plans to sell the loans later this summer and has retained Newmark & Company Real Estate to act as advisor on the sale. This portfolio contains a large concentration of New York City multifamily loans. The FDIC subsequently announced it had retained BlackRock to conduct sales of the securities portfolios of both Signature Bank and Silicon Valley Bank. These portfolios total approximately $120 billion, of which about $15 billion consists of agency CMBS securities (mostly Ginnie Mae project loans and Freddie Mac “K-bonds” from the Silicon Valley Bank portfolio). In our view, these sales create a negative technical headwind for agency CMBS spreads in the near term but are likely to be readily absorbed by the market if sold at a measured pace.
Portfolio Actions: Over the course of the quarter we reduced our exposure to CMBS across all of our strategies. The main focus of the reduction was in the non-agency sector, as we sought to increase liquidity across the portfolios by reducing the aggregate exposure to office properties. The reduction was generally accomplished through reinvesting the proceeds of prepayments and maturities into other sectors rather than the outright sale of our CMBS holdings, although we did sell one AA-rated, floating-rate, single-asset, single-borrower (“SASB”) position in order to reduce spread duration. The impact of this effort was most pronounced in our 1-3 Year portfolios where the end result was a decrease in overall CMBS exposure and a relative increase in the agency component of the remaining CMBS holdings. The same dynamic was also at play in our other portfolios, albeit to a lesser extent. We did not participate in any new issue transactions during the quarter but were active in the secondary market. We purchased a short-tenor agency bond across most of the portfolios and also opportunistically added to our fixed-rate non-agency conduit scheduled balance “ASB” holdings. As we have noted in the past, we believe ASB tranches are more defensive and offer fairly stable average-life profiles across a broad range of collateral prepayment and default scenarios.
Outlook: Given the recent dislocations in the market, the worsening outlook for office properties in particular and ongoing concerns around bank CRE portfolios, we anticipate remaining very defensive over the near term. We expect to see more negative headlines around office properties, regional bank CRE exposure, lower commercial property valuations and the CMBS sector in general. We also anticipate the migration of a significant amount of CMBS office collateral to special servicing status. In such an environment, we believe it will be difficult for CMBS spreads to exhibit any sustained move tighter. Accordingly, we do not anticipate increasing our CMBS exposure across the portfolios. With agency spreads moving wider and the market more volatile, we prefer the liquidity advantage of agency tranches.
Performance: Despite significant weakness in March following the FDIC’s seizures of Silicon Valley Bank and Signature Bank and the forced sale of Credit Suisse to UBS, our CMBS holdings still generated positive excess returns for the quarter after adjusting for their yield curve and duration positioning. Our non-agency holdings generally performed better than our agency holdings with our floating-rate SASB tranches the best performers. Within agencies, our Freddie Mac “K-bond” holdings generally outperformed our Fannie Mae DUS tranches, although both were positive contributors overall.
RMBS
Recap: Residential mortgage-backed spreads widened over the quarter as volatility in the banking sector impacted the financial markets, especially in March. In addition, after the FDIC seized control of Silicon Valley Bank and Signature Bank, mortgage investors focused on the $90 billion of RMBS held in the failed banks’ portfolios which further exacerbated negative market sentiment. The weakness in March saw the Bloomberg mortgage index post a -1.11% monthly excess return. Combined with the -0.29% monthly excess return seen in February, this more than offset January’s positive start for the year (a 0.93% excess return). On a spread basis, generic 30-year collateral ended the quarter at a spread of 158 basis points over ten-year Treasuries (7 basis points wider) while 15-year collateral ended the quarter at a spread of 96 basis points over five-year Treasuries (26 basis points wider). We attribute the relatively better performance of longer collateral to a shift in investor sentiment regarding longer duration assets due to the perception that the issues in the banking sector may stay the Fed’s hand in hiking interest rates. Despite the uptick in volatility, non-agency spreads moved tighter over the quarter as they began the year at relatively wide levels. Prime jumbo front cashflow tranches ended the quarter at a spread of 185 basis points over Treasuries (15 basis points tighter) although non-agency spreads widened 35 basis points in the month of March and 10 basis points in February after tightening dramatically in January to 140 basis points over Treasuries. Limited new issue supply has likely supported non-agency spreads in our view.
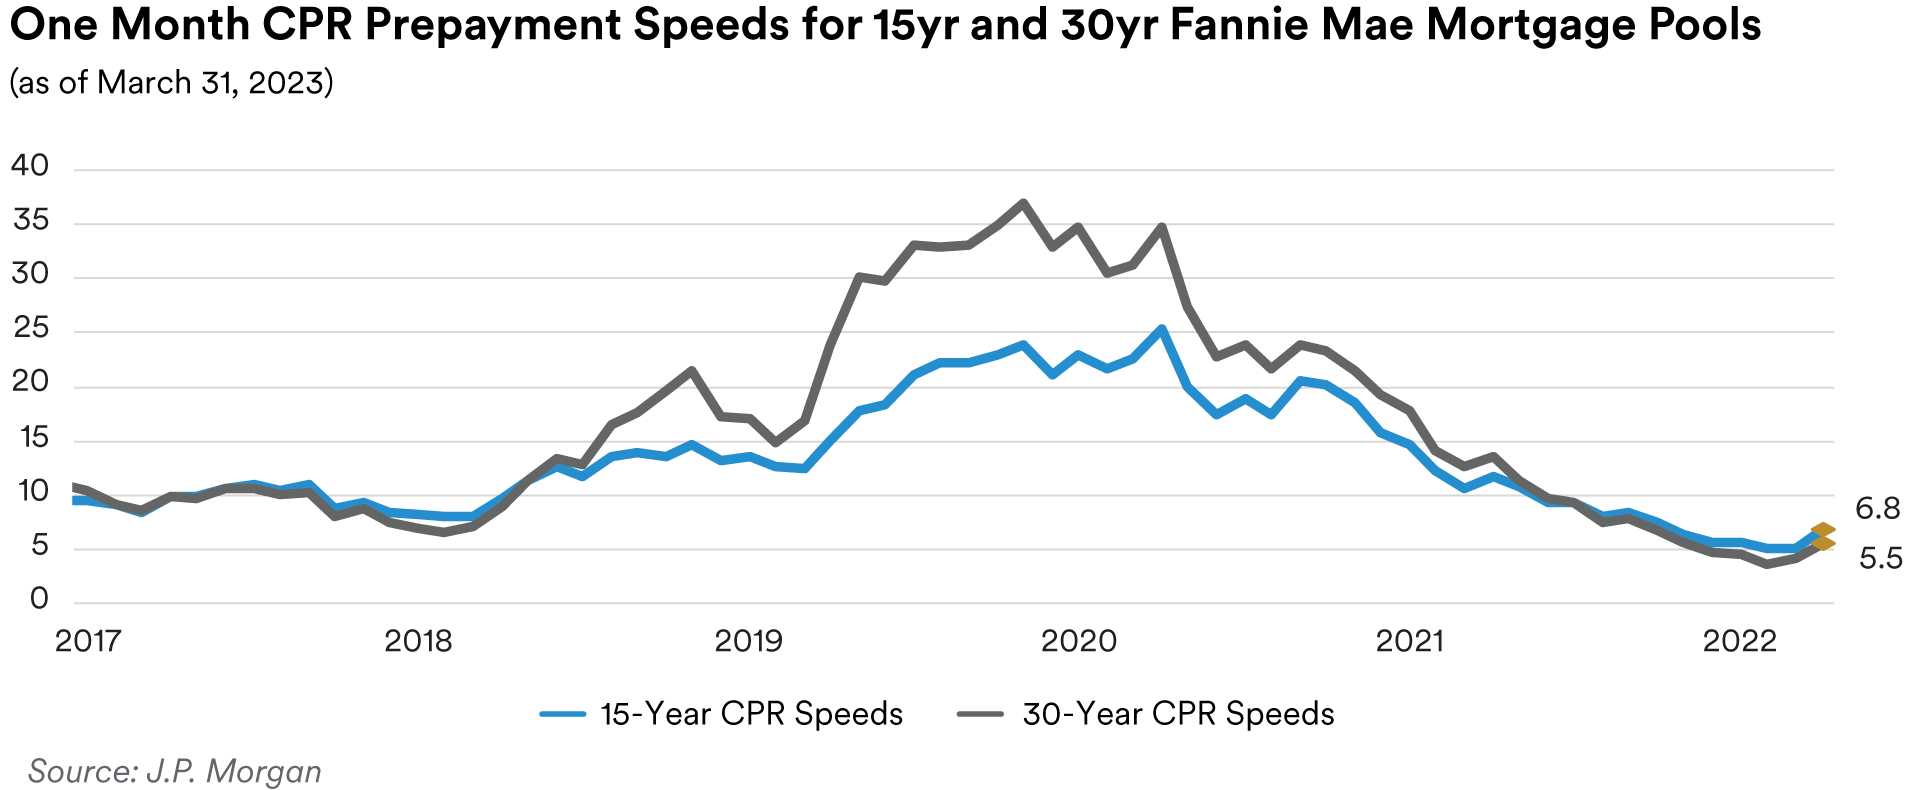
Mortgage rates ended the quarter lower with the Freddie Mac 30-year fixed-rate mortgage commitment rate ending March at 6.24%, 17 basis points lower than the end of December 2022. Despite the lower rates, most mortgages are still outside of the refinancing window, so prepayment speeds remain muted though the close of the quarter saw some acceleration off recent slower speeds. April’s recent prepayment report showed 30-year Fannie Mae mortgages paying at 5.5 CPR in March, up 34% from February’s 4.1 CPR print, which was in turn 11% faster than the 3.7 CPR posted in January. Fifteen-year mortgages were also faster at the end of the quarter, paying 6.8 CPR in March, up 33% from February’s 5.1 CPR print, which was flat compared to January. With the approach of the spring selling season and 5 and 10-year interest rates 40 basis points lower than at the start of the year, we expect prepayments to modestly accelerate over the next few months. The Case-Shiller National Home Price Index continued its slump, falling for the seventh straight month. March’s release showed that as of January housing prices are now only up 3.8% on an annualized basis, compared to the 5.6% annual gain seen at the end of the year. Some areas are now seeing year-over-year price declines with San Francisco down 7.6%, Seattle down 5.1% and San Diego down 1.4%. The best performing markets were Miami (+13.8%), Tampa (+10.5%) and Atlanta (+8.4%) but even those markets are well off the 20-30% growth rates they saw a year ago. Given the affordability challenges still facing the housing market, we expect that home price gains are likely to remain subdued for the foreseeable future.
With mortgage rates moving lower and home prices softening, home buyers who had perhaps been sidelined by affordability constraints fueled a snap-back in existing home sales, breaking a year-long slide. March’s data exceeded economist projections as sales rose 14.5% in February to an annualized pace of 4.6 million. The inventory of homes for sale held steady at 980,000 which would take 2.6 months to sell at the current sales pace. While it represents an improvement in supply compared to the 1.7 months seen a year ago, it still reflects a housing market with scarce inventory. Realtors consider anything below five months of supply as indicative of a tight housing market. New home sales came in at a 640,000 annualized pace, a 1.1% gain compared to January’s 633,000 rate, which was revised downward, and the strongest pace since last August. Homebuilder sentiment improved each month during the quarter, despite the continued challenges of elevated materials costs and difficulty of finding skilled labor. The National Association of Home Builders sentiment index came in at 44 in March, the highest level since September following prints of 42 in February and 35 in January. However, even with the recent improvement, the index is well below levels seen before the pandemic.
The January release of the Senior Loan Officer Survey, reflecting sentiment as of the fourth quarter of last year, showed banks tightened or maintained lending standards for most residential real estate loans with some banks reporting tighter standards for jumbo and subprime loans and HELOCs. Banks reported generally weaker demand for all types of residential real estate loans. As part of a set of special questions in the survey, banks were asked about their expectations for changes in lending standards, borrower demand and asset quality over 2023. Most banks expected lending standards to tighten, loan demand to weaken and asset quality to deteriorate. Given that the survey reflects sentiment prior to the March banking crisis, in our view banks have likely now shifted to a much more conservative stance regarding lending standards and also are likely to now have much gloomier expectations regarding asset deterioration this year.
Portfolio Actions: Over the course of the quarter, we slightly decreased our RMBS exposure in our 1-3 Year and longer strategies while slightly increasing exposure in our shorter strategies. The decline in our longer strategies was a result of reinvesting portfolio paydowns in other spread sectors. The increase in the shorter strategies reflects secondary market purchases. We opportunistically added non-agency tranches in all of the shortest strategies and our Cash Plus strategy also added agency CMO tranches.
Outlook: Going forward, the market is likely to face continued macro volatility in the short term and with the Fed grappling with both persistent inflation and a slowing economy, uncertainty around the direction of interest rates. In addition, the negative technical overhang of RMBS portfolios held at both the Fed and now the FDIC, we expect further headwinds for mortgage spreads. Accordingly, we anticipate maintaining our current relatively low level of RMBS exposure. Similar to last quarter, we find that seasoned 20-year pools (which are deliverable into the 30-year TBA market) offer good value relative to some 15-year specified pools, and we continue to evaluate potential swaps of some of our 15-year holdings into seasoned 20-year pools. We also remain opportunistic around nonagencies, although in the current environment we are very sensitive regarding the lower liquidity of these tranches compared to agency specified pool alternatives.
Performance: Our RMBS positions generated negative excess returns for the quarter across all of our strategies in the wake of wider benchmark spreads. Our shorter and longer strategies performed better than our 1-3 Year and 1-5 Year strategies due to lower weightings in non-agency tranches which were generally our worst performers. Our agency CMOs performed the best, posting slight positive performance across all strategies except for our Cash Plus strategy. Our specified pool positions were negative across all strategies with our seasoned 3.5% pools generally performing better than lower coupons. This was due to their relatively higher coupon income mitigating the impact of wider spreads.
Municipals
Recap: Total municipal new issue supply was $76 billion over the first quarter, a 26% decline from the 2022’s first quarter. The higher interest rate environment continued to hamper refunding activity (included in the total supply), resulting in a decline of 45% on a year-over-year basis. Despite fixed income market volatility over the quarter and a continued lack of supply, investor demand for higher quality assets supported the taxable municipal market, which resulted in taxable municipals having positive absolute and excess returns during the first quarter. For the quarter, the ICE BofA 1-5 Year U.S. Taxable Municipal Securities Index total return was +2.27% versus the ICE BofA 1-5 Year U.S. Treasury Index total return of +1.82%.

Notable ratings actions during the quarter include the State of Illinois upgrade to A3/A- from Baa1/BBB+ by Moody’s and S&P, respectively, and Fitch changing their outlook on the State’s BBB+ rating to Positive from Stable. Collectively, the rating agencies noted steps Illinois has taken to strengthen budgetary flexibility and stability, debt repayment, building reserve funds, and improving pension funding levels in their upgrade rationales. Improved reserve levels and financial foundation were similarly factors in Fitch’s upgrade of New York City to AA from AA- in February. In addition, a few of our holdings in the transportation sector had positive ratings changes over the quarter. In March, Fitch upgraded Miami-Dade, FL International Airport to A+ from A. The rating action reflected the airport’s outperformance in enplanement recovery, surpassing its prepandemic traffic high by nearly 10%, strong market position for both domestic and international travel, and stable financial results. Other transportation holdings that had rating actions include upgrades by S&P of our Hawaii Airport holdings to AA- from A+ in March and our Ontario, CA Airports to A from A- by S&P in February.
Based on U.S. Census Bureau data collected for state and local tax revenues through December 31, 2022, we are experiencing a decline in the pace of revenue growth overall for the four major tax sources (personal income, corporate income, sales, and property taxes). The below graph highlights moderation in revenue receipts at the state level, with a demonstrated lag effect at the local level, when comparing year-over-year percent change in revenues from these major sources on a trailing four-quarter average basis.

Pension funding levels impact state budgets with lower levels having the potential to stress balance sheets with one indicator we monitor being Milliman’s Public Pension Funding Index, which is comprised of the 100 largest U.S. public pension plans. This index fluctuated with market volatility and net negative cash flows during the first two months of the quarter. The Index increased to 75.4% at the end of January from 72.6% in December, and then declined to 73.6% at the end of February. While the index is experiencing improvement, it remains below the 85.5% ratio reached at year-end 2021.
Portfolio Actions: Our allocation to Taxable Municipals decreased in our shortest duration strategies and levels were maintained in our other strategies over the first quarter. Given municipal spread tightening and limited new issue supply, our activity has been primarily focused on selling short-duration positions that we believe are fully valued with the mindset of building liquidity across the portfolios. Against a backdrop of general market volatility, purchases in the taxable municipal space were defensively focused and liquidity driven. Our purchase activity included adds to a few favored issuers in the airport sector, along with select adds to healthcare names.
Outlook: At the state level, our outlook is for elevated inflation and wage pressures, coupled with the potential for further revenue growth moderation, potentially causing modest pressure in FY24. However, total fund balances of over 25% at FYE 2023 should provide increased flexibility despite slowing revenue growth. Additionally, volatile capital markets and sticky inflation have worked to inject expense uncertainty into the mix as well as a possible reemergence of pension risks. As it relates to local governments, those with above-average economically sensitive revenue mixes will be increasingly exposed to budget gaps as the economy slows in 2023/24. Conversely, governments supported primarily by property taxes may fare better in the short term given the real estate tax assessment lag. Rising rates and work-from-home will continue to weigh on both residential and commercial values which, in turn, are likely to pressure tax bases for local governments. For revenue bonds, we will continue to look for opportunities to add to essentialservice issuers. Water and sewer utilities remain resilient with sound debt service coverage and significant liquidity levels, and rate increases that were postponed during the pandemic have been reinstated. This sector continues to be amongst the most stable, but future challenges include growing capital needs due to aging infrastructure and environmental regulation, coupled with rising rates and operating costs due to inflation. Power utilities faced a roller coaster year in 2022 as natural gas and coal prices spiked through the middle of the year, which created significant expense pressure for customers. As the year came to a close, commodity prices decreased, and many utilities are set to recoup inflated commodity costs over longer time periods than usual. We believe this sector is well-positioned with the commodity reset, giving the utilities flexibility as it relates to capital expenditures. The industry continues to accelerate the renewable generation transition, which was further supported by the passage of the Inflation Reduction Act of 2022 that will provide tax incentives for projects.
We continue to evaluate opportunities both in the primary and secondary markets for relative value, creditworthiness, and those that fit with our defensive bias. While we remain constructive on overall credit fundamentals in the municipal space, we are cognizant of the potential for pressure on budgets with changes in the macroeconomic landscape. We continue to favor issuers who have well-positioned balance sheets and liquidity along with the operating and financial flexibility to manage through a potential economic downturn. In an investment environment characterized by macro market volatility and economic uncertainty, we view an allocation to the municipal sector as a defensive alternative to other spread sectors and will seek relative value opportunities to increase this allocation during periods of spread widening.
Performance: Our Taxable Municipal holdings generated positive performance across our strategies in the first quarter. On an excess return basis, some of our better performing sectors included Healthcare, Tax-Backed, and Transportation issues. Holdings in airports were mixed but positive in aggregate and select holdings in Housing and Power generated slightly negative excess returns.
Disclaimers
This document is being provided to you at your specific request. This document has been prepared by MetLife Investment Management LLC., a U.S. Securities Exchange Commission-registered investment adviser.
For investors in the United Kingdom, this document is being distributed by MetLife Investment Management Limited (“MIML”), authorized and regulated by the UK Financial Conduct Authority (FCA reference number 623761), registered address 1 Angel Lane 8th Floor London EC4R 3AB United Kingdom. This document is only intended for, and may only be distributed to, investors in the EEA who qualify as a Professional Client as defined under the EEA’s Markets in Financial Instruments Directive, as implemented in the relevant EEA jurisdiction. The investment strategy described herein is intended to be structured as an investment management agreement between MIML (or its affiliates, as the case may be) and a client, although alternative structures more suitable for a particular client can be discussed.
MIMEL: For investors in the EEA, this document is being distributed by MetLife Investment Management Europe Limited (“MIMEL”), authorised and regulated by the Central Bank of Ireland (registered number: C451684), registered address 20 on Hatch, Lower Hatch Street, Dublin 2, Ireland. This document is approved by MIMEL as marketing communications for the purposes of the EU Directive 2014/65/EU on markets in financial instruments (“MiFID II”). Where MIMEL does not have an applicable cross-border licence, this document is only intended for, and may only be distributed on request to, investors in the EEA who qualify as a “professional client” as defined under MiFID II, as implemented in the relevant EEA jurisdiction. The investment strategies described herein are directly managed by delegate investment manager affiliates of MIMEL. Unless otherwise stated, none of the authors of this article, interviewees or referenced individuals are directly contracted with MIMEL or are regulated in Ireland. Unless otherwise stated, any industry awards referenced herein relate to the awards of affiliates of MIMEL and not to awards of MIMEL.
For Investors in Hong Kong: This document is being issued by MetLife Investments Asia Limited (“MIAL”), a part of MIM, and it has not been reviewed by the Securities and Futures Commission of Hong Kong (“SFC”).
For investors in Japan, this document is being distributed by MetLife Asset Management Corp. (Japan) (“MAM”), a registered Financial Instruments Business Operator (“FIBO”) conducting Investment Advisory Business, Investment Management Business and Type II Financial Instruments Business under the registration entry “Director General of the Kanto Local Finance Bureau (Financial Instruments Business Operator) No. 2414” pursuant to the Financial Instruments and Exchange Act of Japan (“FIEA”), and a regular member of the Japan Investment Advisers Association and the Type II Financial Instruments Firms Association of Japan. In its capacity as a discretionary investment manager registered under the FIEA, MAM provides investment management services and also sub-delegates a part of its investment management authority to other foreign investment management entities within MIM in accordance with the FIEA. This document is only being provided to investors in Japan who are Qualified Institutional Investors (tekikaku kikan toshika) as defined in Article 10 of Cabinet Office Ordinance on Definitions Provided in Article 2 of the FIEA. It is the responsibility of each prospective investor to satisfy themselves as to full compliance with the applicable laws and regulations of any relevant territory, including obtaining any requisite governmental or other consent and observing any other formality presented in such territory.
MetLife, Inc. provides investment management services to affiliates and unaffiliated/third party clients through various subsidiaries.1 MetLife Investment Management (“MIM”), MetLife, Inc.’s institutional investment management business, has more than 900 investment professionals located around the globe. MIM is responsible for investments in a range of asset sectors, public and privately sourced, including corporate and infrastructure private placement debt, real estate equity, commercial mortgage loans, customized index strategies, structured finance, emerging market debt, and high yield debt. The information contained herein is intended to provide you with an understanding of the depth and breadth of MIM’s investment management services and investment management experience. This document has been provided to you solely for informational purposes and does not constitute a recommendation regarding any investments or the provision of any investment advice, or constitute or form part of any advertisement of, offer for sale or subscription of, solicitation or invitation of any offer or recommendation to purchase or subscribe for any securities or investment advisory services. Unless otherwise specified, the information and opinions presented or contained in this document are provided as of the quarter end noted herein. It should be understood that subsequent developments may affect the information contained in this document materially, and MIM shall not have any obligation to update, revise or affirm. It is not MIM’s intention to provide, and you may not rely on this document as providing, a complete or comprehensive analysis of MIM’s investment portfolio, investment strategies or investment recommendations.
No money, securities or other consideration is being solicited. No invitation is made by this document or the information contained herein to enter into, or offer to enter into, any agreement to purchase, acquire, dispose of, subscribe for or underwrite any securities or structured products, and no offer is made of any shares in or debentures of a company for purchase or subscription. Prospective clients are encouraged to seek advice from their legal, tax and financial advisors prior to making any investment.
Confidentiality. By accepting receipt or reading any portion of this Presentation, you agree that you will treat the Presentation confidentially. This reminder should not be read to limit, in any way, the terms of any confidentiality agreement you or your organization may have in place with Logan Circle. This document and the information contained herein is strictly confidential (and by receiving such information you agree to keep such information confidential) and are being furnished to you solely for your information and may not be used or relied upon by any other party, or for any other purpose, and may not, directly or indirectly, be forwarded, published, reproduced, disseminated or quoted to any other person for any purpose without the prior written consent of MIM. Any forwarding, publication, distribution or reproduction of this document in whole or in part is unauthorized. Any failure to comply with this restriction may constitute a violation of applicable securities laws.
Past performance is not indicative of future results. No representation is being made that any investment will or is likely to achieve profits or losses or that significant losses will be avoided. There can be no assurance that investments similar to those described in this document will be available in the future and no representation is made that future investments managed by MIM will have similar returns to those presented herein.
No offer to purchase or sell securities. This Presentation does not constitute an offer to sell or a solicitation of an offer to buy any security and may not be relied upon in connection with the purchase or sale of any security.
No reliance, no update and use of information. You may not rely on this Presentation as the basis upon which to make an investment decision. To the extent that you rely on this Presentation in connection with any investment decision, you do so at your own risk. This Presentation is being provided in summary fashion and does not purport to be complete. The information in the Presentation is provided to you as of the dates indicated and MIM does not intend to update the information after its distribution, even in the event that the information becomes materially inaccurate. Certain information contained in this Presentation, includes performance and characteristics of MIM’s by independent third parties, or have been prepared internally and have not been audited or verified. Use of different methods for preparing, calculating or presenting information may lead to different results for the information presented, compared to publicly quoted information, and such differences may be material.
Risk of loss. An investment in the strategy described herein is speculative and there can be no assurance that the strategy’s investment objectives will be achieved. Investors must be prepared to bear the risk of a total loss of their investment.
No tax, legal or accounting advice. This Presentation is not intended to provide, and should not be relied upon for, accounting, legal or tax advice or investment recommendations. Any statements of U.S. federal tax consequences contained in this Presentation were not intended to be used and cannot be used to avoid penalties under the U.S. Internal Revenue Code or to promote, market or recommend to another party any tax-related matters addressed herein. Forward-Looking Statements. This document may contain or incorporate by reference information that includes or is based upon forward-looking statements within the meaning of the Private Securities Litigation Reform Act of 1995. Forward-looking statements give expectations or forecasts of future events. These statements can be identified by the fact that they do not relate strictly to historical or current facts. They use words and terms such as “anticipate,” “estimate,” “expect,” “project,” “intend,” “plan,” “believe,” “will,” and other words and terms of similar meaning, or are tied to future periods in connection with a discussion of future performance. Forward-looking statements are based on MIM’s assumptions and current expectations, which may be inaccurate, and on the current economic environment which may change. These statements are not guarantees of future performance. They involve a number of risks and uncertainties that are difficult to predict. Results could differ materially from those expressed or implied in the forward-looking statements. Risks, uncertainties and other factors that might cause such differences include, but are not limited to: (1) difficult conditions in the global capital markets; (2) changes in general economic conditions, including changes in interest rates or fiscal policies; (3) changes in the investment environment; (4) changed conditions in the securities or real estate markets; and (5) regulatory, tax and political changes. MIM does not undertake any obligation to publicly correct or update any forward-looking statement if it later becomes aware that such statement is not likely to be achieved.
1 MetLife Investment Management (“MIM”) is MetLife, Inc.’s institutional management business and the marketing name for subsidiaries of MetLife that provide investment management services to MetLife’s general account, separate accounts and/ or unaffiliated/third party investors, including: Metropolitan Life Insurance Company, MetLife Investment Management, LLC, MetLife Investment Management Limited, MetLife Investments Limited, MetLife Investments Asia Limited, MetLife Latin America Asesorias e Inversiones Limitada, MetLife Asset Management Corp. (Japan), and MIM I LLC, MetLife Investment Management Europe Limited and Affirmative Investment Management Partners Limited.


-Index-1Q-2023.png)


