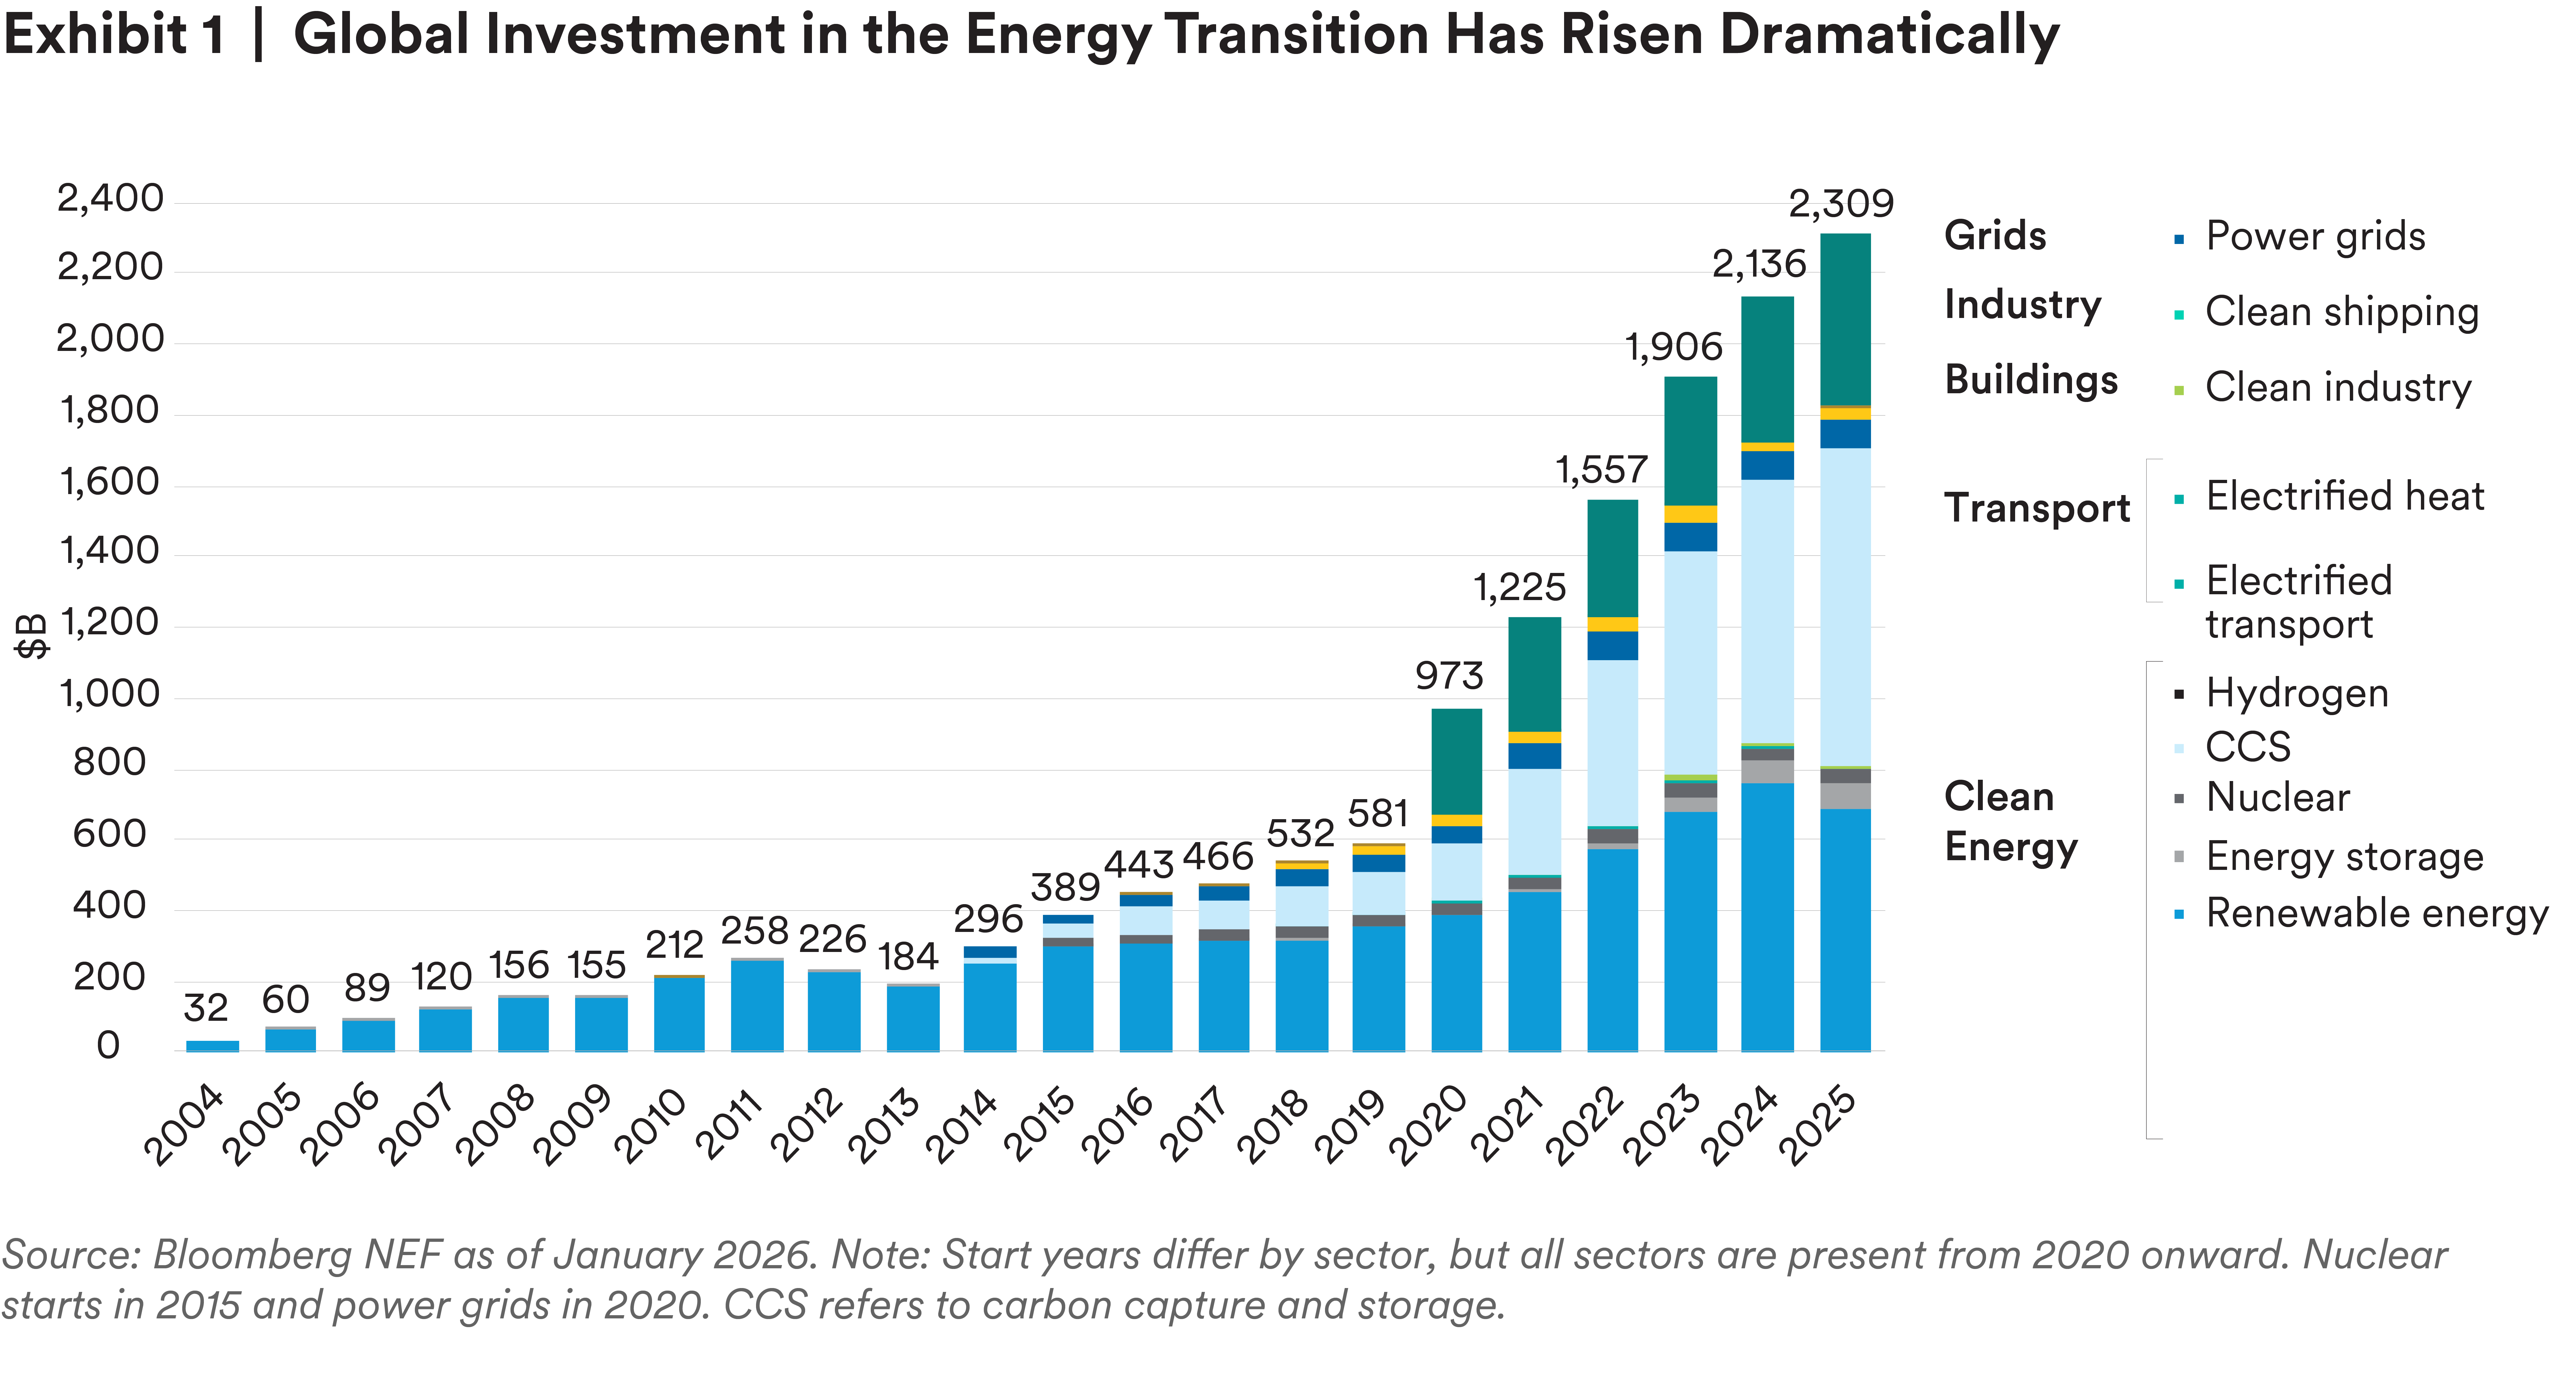
Despite policy headwinds and a challenging economic outlook, the energy transition is advancing globally. Total investment globally grew 8% in 2025 to reach a record $2.3 trillion.1 Behind the headline number, however, the transition is progressing in complex and uneven ways across sectors and geographies.
The trajectory the transition takes from this point forward depends on solving concrete execution challenges, such as building out and connecting to power grids, creating resilient financing structures and agreeing on durable and pragmatic policy frameworks. As sustainability researchers and infrastructure investors, we think three dynamics encapsulate the direction the energy transition has followed in recent years.
- The momentum behind renewable energy has continuously outpaced expectations. Cost curves for renewables have shifted downward, and the increasing affordability and availability of utility-scale battery storage supports growth in key markets.
- Despite the significant contribution heavy industry makes to global greenhouse gas (GHG) emissions, the sector has experienced stalled progress in decarbonization. Technological, policy and economic factors present significant hurdles for investment and scalability.
- The role of China in the global energy transition cannot be understated, both in the scale of domestic investment and deployment and Chinese dominance of clean tech manufacturing and exports.
This paper presents our views on where the transition is already investable at scale, where execution risk is becoming an important constraint, and where the transition may still depend on more durable policy frameworks.
Demand for power has grown in recent years, driven by electrification and the rapid expansion of data centers. However, constraints on the energy system, including lengthy interconnection queues, permitting challenges, and headwinds across most forms of generation have created obstacles to building new generation capacity. Combustion gas turbines face significant supply chain challenges, for example, while nuclear projects have been experiencing cost overruns and delays. Likewise, the U.S. government has challenged offshore wind projects. Power sector growth today is increasingly limited not by the interest in new generation, but by the speed at which projects can secure interconnections, transmission access, permitting, equipment, and long-term contracts. Individually and combined, these kinds of constraints can directly impact the pace of project development and construction, and ultimately, the success of project financing for new generation assets.
Despite these challenges, wind and solar generation continue to show resilient growth and play important roles in the global energy system. The estimated 800 GW of global wind and solar installations in 2025 reflects a tripling in yearly additions since 2021.2 Ember, an energy think tank, reported that wind and solar supplied 17.6% of global electricity in the first nine months of 2025, up from 15.2% over the same period in 2024.3 Should the prices of solar modules and batteries continue to decline, those percentages could rise.
The demand for power is so great that investment in renewables and other energy transition technology has grown rapidly around the world (Exhibit 1). In the United States, wind and solar now account for 30% of annual generation in Texas. Hydropower imports from Canada via the Champlain Hudson Power Express HVDC transmission are expected to support New York’s efforts to meet increasing power demand with low-carbon generation.4
In the European Union, renewable energy increasingly dominates the power mix, accounting for almost 50% of total EU electricity generation.5 However, the energy transition has been highly uneven in Europe, with stark differences in renewable electricity generation across European countries. A small group of northern European countries, most notably Norway, Iceland, Austria, Sweden and Denmark, rely overwhelmingly on renewables for electricity generation, largely due to abundant hydropower and wind resources. Countries such as Malta, Luxembourg and Hungary remain at a much earlier stage, with renewables accounting for less than a quarter of electricity generation.6
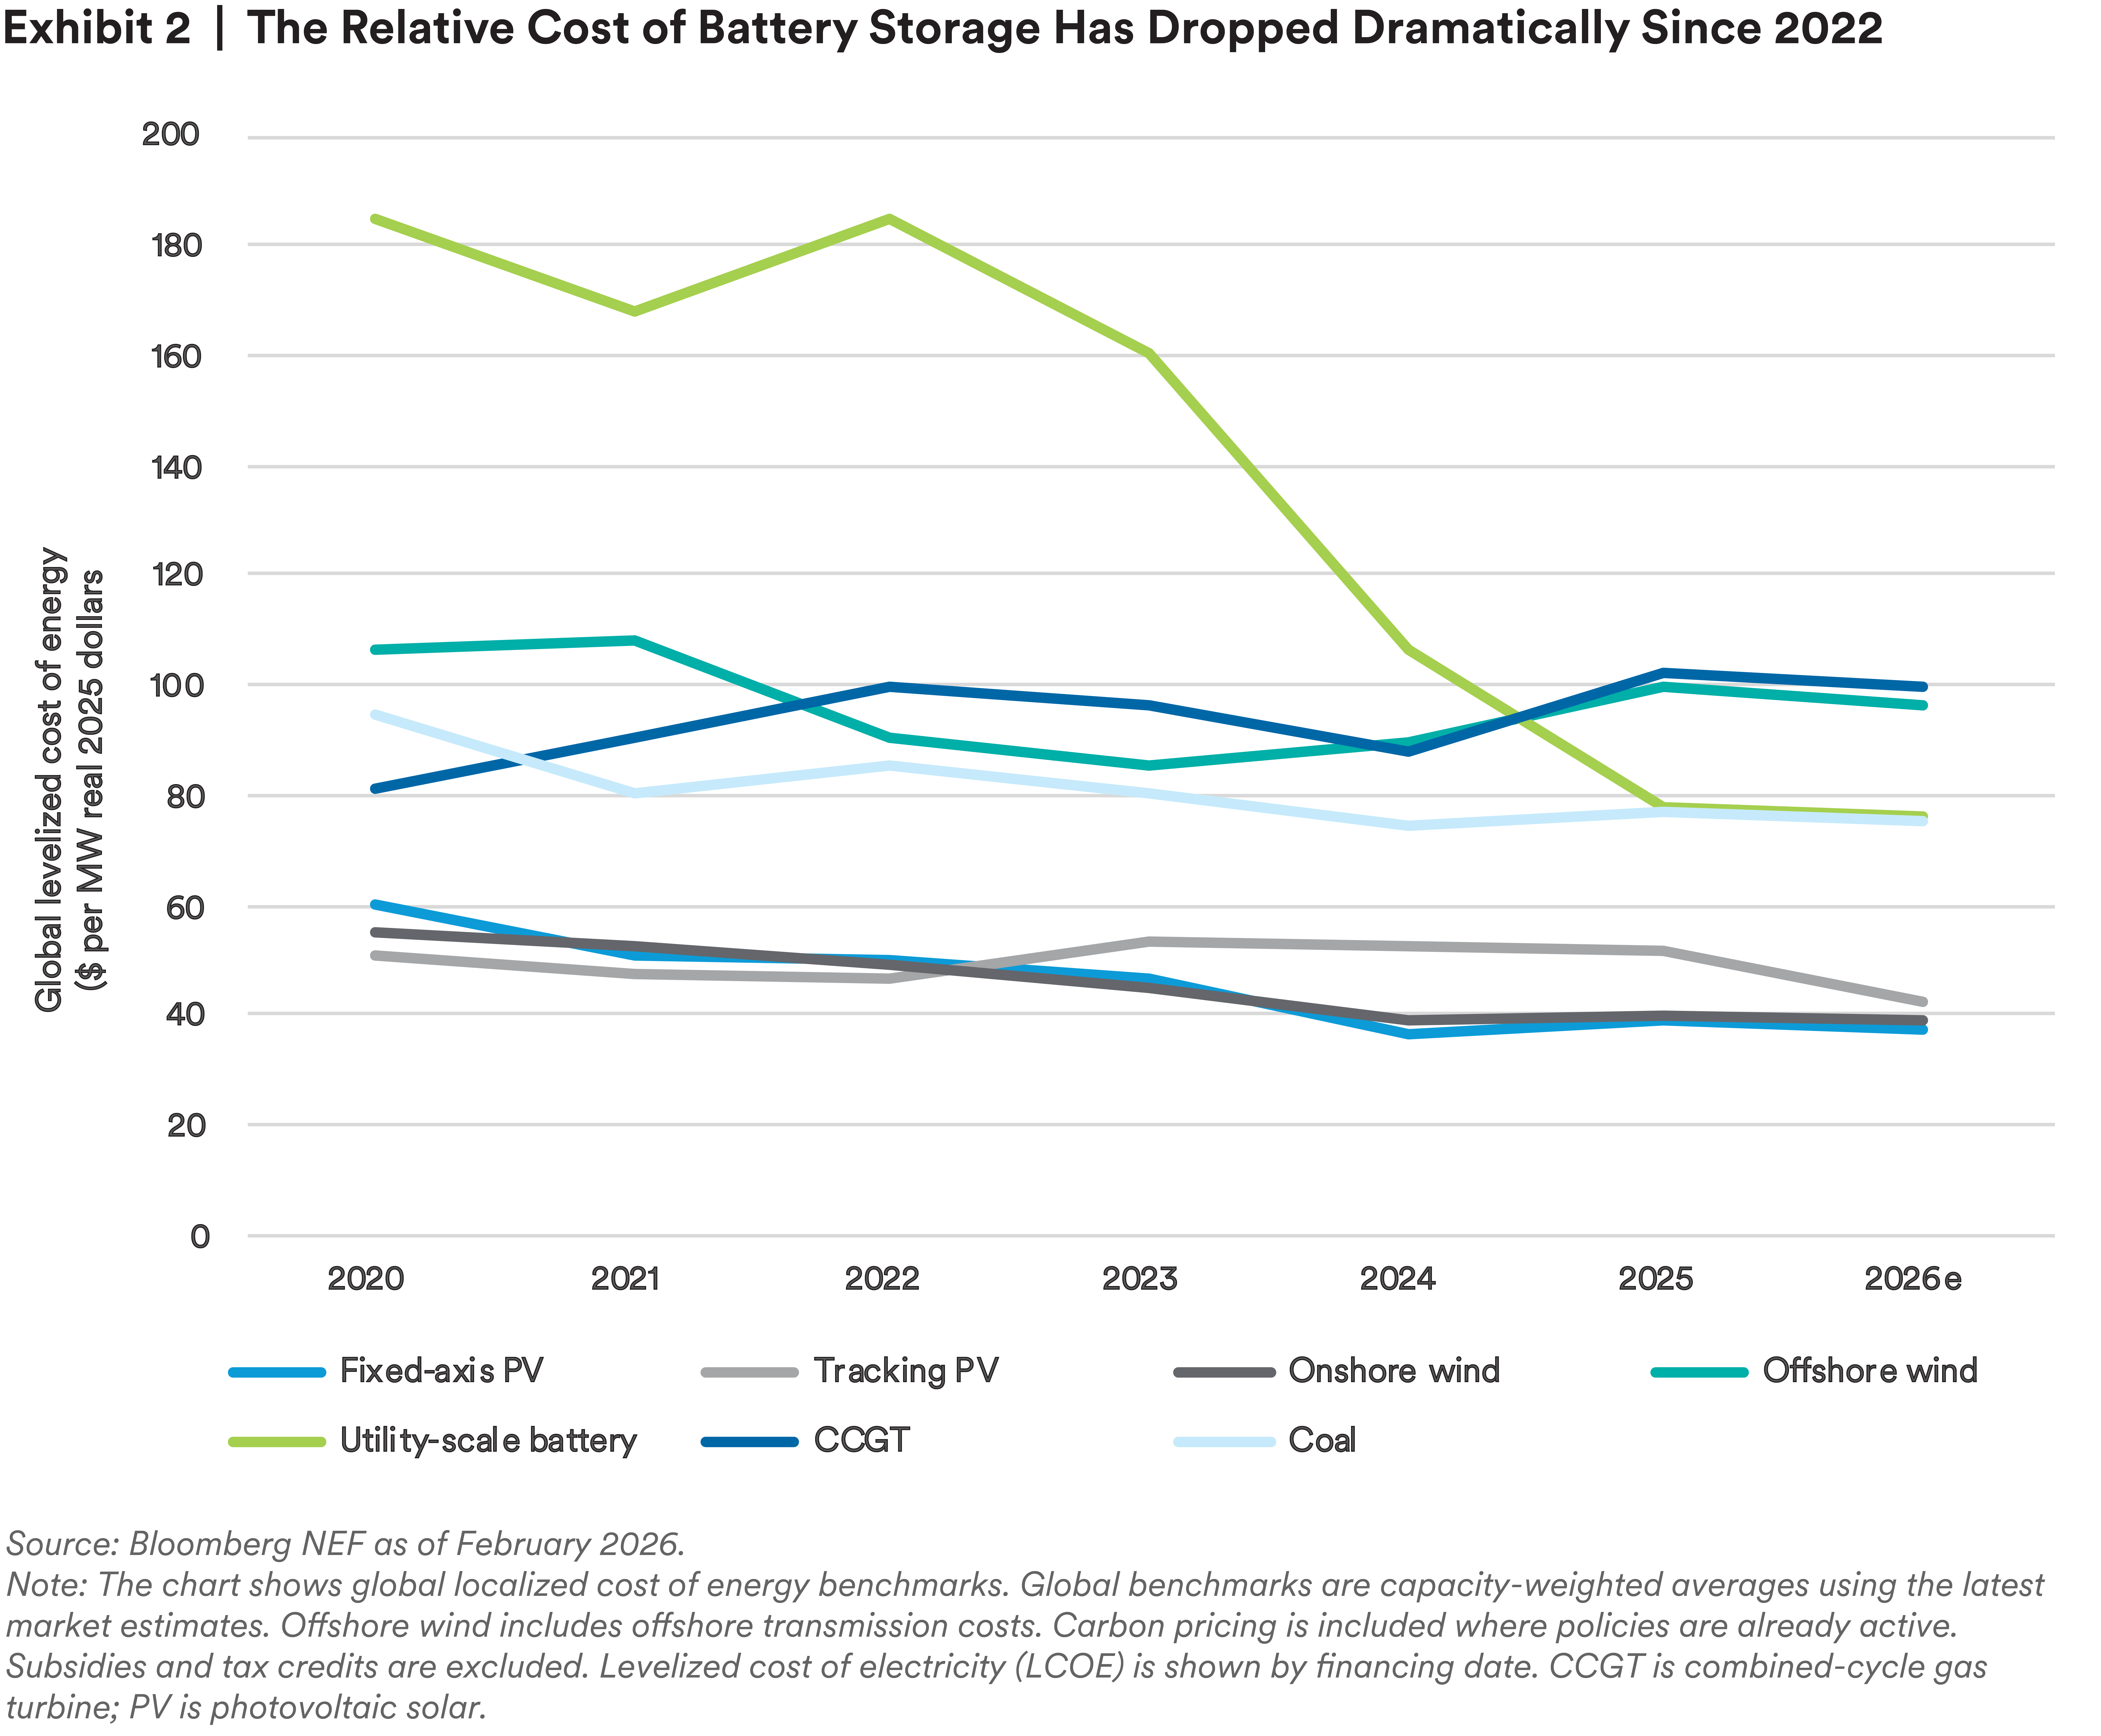
Without materially faster transmission infrastructure build-out, power grids risk adding low-cost renewables generation in places where it either cannot be delivered or won’t be optimized or fully monetized. Energy storage systems are an increasingly important answer to this problem, and investment has surged as prices have declined (Exhibit 2).7 The International Energy Agency (IEA) estimates that energy storage investment surpassed $65 billion in 2025.8 Battery systems boasting gigawatt-size capacity accounted for a record 30% of installations, reflecting an increasing focus on utility-scale applications.9 In some parts of the United States, battery storage, coupled with renewables, are an increasingly important part of the grid. In California, for example, battery storage capacity reached nearly 17,000 MW in 2025, allowing excess solar capacity produced during the day to supply an increasing proportion of electricity at night. Indeed, it’s not just that batteries are getting cheaper. They’re becoming critical tools in solving challenges to solar power, including intermittency, ramping (quick changes in solar output due to, for example, clouds rolling in) and congestion (the sun producing more power than the grid can handle at one time).10 These solutions are especially important in sunny places that are well positioned to take advantage of solar power.
Traditional renewables and battery storage alone are unlikely to meet the growing demand for energy and increasing focus on security of supply. Low‑carbon baseload technologies, such as nuclear power, can play an important role in facilitating the transition away from fossil fuels and strengthening energy independence. However, large‑scale nuclear projects have frequently faced public opposition, significant cost overruns, and construction delays. In this context, France’s long‑standing track record in developing nuclear capacity as a cornerstone of its energy security strategy could serve as a valuable reference for other countries navigating a turbulent environment in which energy security has become a matter of strategic importance.
Heavy industry accounts for a significant share of global GHG emissions. Despite a host of low-carbon project announcements and corporate decarbonization commitments, however, industrial decarbonization has been slower than in other parts of the economy. A combination of technological, structural, and regulatory factors has made it difficult to reduce emissions to date and is likely to continue to do so.
In addition to technical hurdles, industrial decarbonization lacks a scaled, durable, and commercially viable model in most cases. Many industrial decarbonization technologies are not only expensive but depend on uncertain input costs and have few off-takers willing to pay green premiums. Policy support for industrial decarbonization is also evolving, and infrastructure is not yet built at scale.
The steel industry, which accounts for 7%–8% of global GHG emissions, provides a clear example.11 The decarbonization efforts in primary steel production have largely focused on the use of direct reduced iron (DRI), which uses natural gas or hydrogen in place of coal. However, many projects using this technology have been delayed or canceled. For example, a U.S. steelmaker canceled a planned $500 million hydrogen-based steel project in Ohio, citing hydrogen supply-chain challenges and uncertainty around continued federal policy support.12 In Europe, two proposed hydrogen-based steel projects in Bremen and Eisenhuttenstadt were canceled despite promises of €1.3 billion in subsidies.13, 14
The challenges stem, in part, from systemic issues: Hydrogen-based decarbonization depends on an entire supply chain being economic across multiple inputs. The issue is not just the cost of hydrogen production, but also the simultaneous need for reliable green power to run the electrolyzers that help produce hydrogen, transportation and logistics infrastructure, storage, and other considerations.
The structural features of heavy industry add further barriers to decarbonization. The production of commodities, such as steel and chemicals, takes place at a small number of large, energy-intensive assets that are costly to replace or retrofit. Given that these are cyclical industries with thin margins and face both technology uncertainty and higher operating costs that can’t necessarily be passed on to customers, it is challenging for companies to commit to large volumes of CapEx.
This stands in contrast to other high-emitting sectors, such as power and transport, where the cost of key technologies, has fallen dramatically in recent years. A key reason for this is the modular nature of technologies, such as the turbines used on wind farms or the battery cells that power electric vehicles. These technologies are based on standardized, repeatable units, which drive economies of scale and help reduce costs. Such technologies can also be deployed incrementally, without requiring wholesale replacement of large assets. While shipping vessels are large, custom-built, heavy assets, they can be retrofitted with more modular components, rather than being fully replaced. Investment in the sector is increasing, with 2025 recording an aggregate spend of $4 billion in green shipping, up from $0.5 billion in 2024. For example, MetLife Investment Management was the lead investor in the 2024 Atal Solutions’ Blue Astra Maritime note issuance, which financed the retrofitting of four vessels and won an Energy Transition Award from IJGlobal.15
Considering the challenges heavy industry faces, rolling out decarbonization technologies more broadly will require policy support in many cases. Several geographies have offered such support, but the impact has still been relatively muted for two reasons. First, the long-term policy certainty required for companies to invest in these technologies at scale is still absent. For example, several companies had to pause or cancel projects after the U.S. Industrial Demonstrations Program, an industrial decarbonization program, terminated grants in 2025. A carbon capture and storage project at an Indiana cement plant16 and a proposed blue hydrogen project in Baytown, Texas were among those projects.17 Second, several industrial decarbonization projects have been canceled despite being awarded large subsidies.18 Companies cited a variety of reasons, including economic viability, the slower than anticipated development of hydrogen demand and infrastructure, and a need for more regulatory support. Considering the nascent nature of the technologies required, the structural features of the sector and the limitations of policy support, we think heavy industry will remain challenging to decarbonize, until the solutions are more economically competitive and can be deployed at scale.
China’s importance in the energy transition continues to grow, both through domestic expansion of renewable energy, clean transport and electrification technologies, and through the country’s increasing dominance across global supply chains.
Clean energy investments in China totalled $1 trillion in 2025, making it the largest market for clean energy worldwide and superseding domestic investment in fossil fuel extraction and coal power by a factor of four. By one estimate, clean energy investment was equivalent to more than one-third of China’s GDP growth in 2025.19 This growing investment is clearly reflected in the real economy, as renewable energy, electrification and electrified transport have continued to grow, year on year. As demand for power rises in China, clean energy’s share of power generation is rapidly increasing, thanks to continued investment in renewables, grids and storage. These investments also have the ripple effect of reducing the cost of clean electricity technologies around the world, thereby accelerating uptake in other countries.20
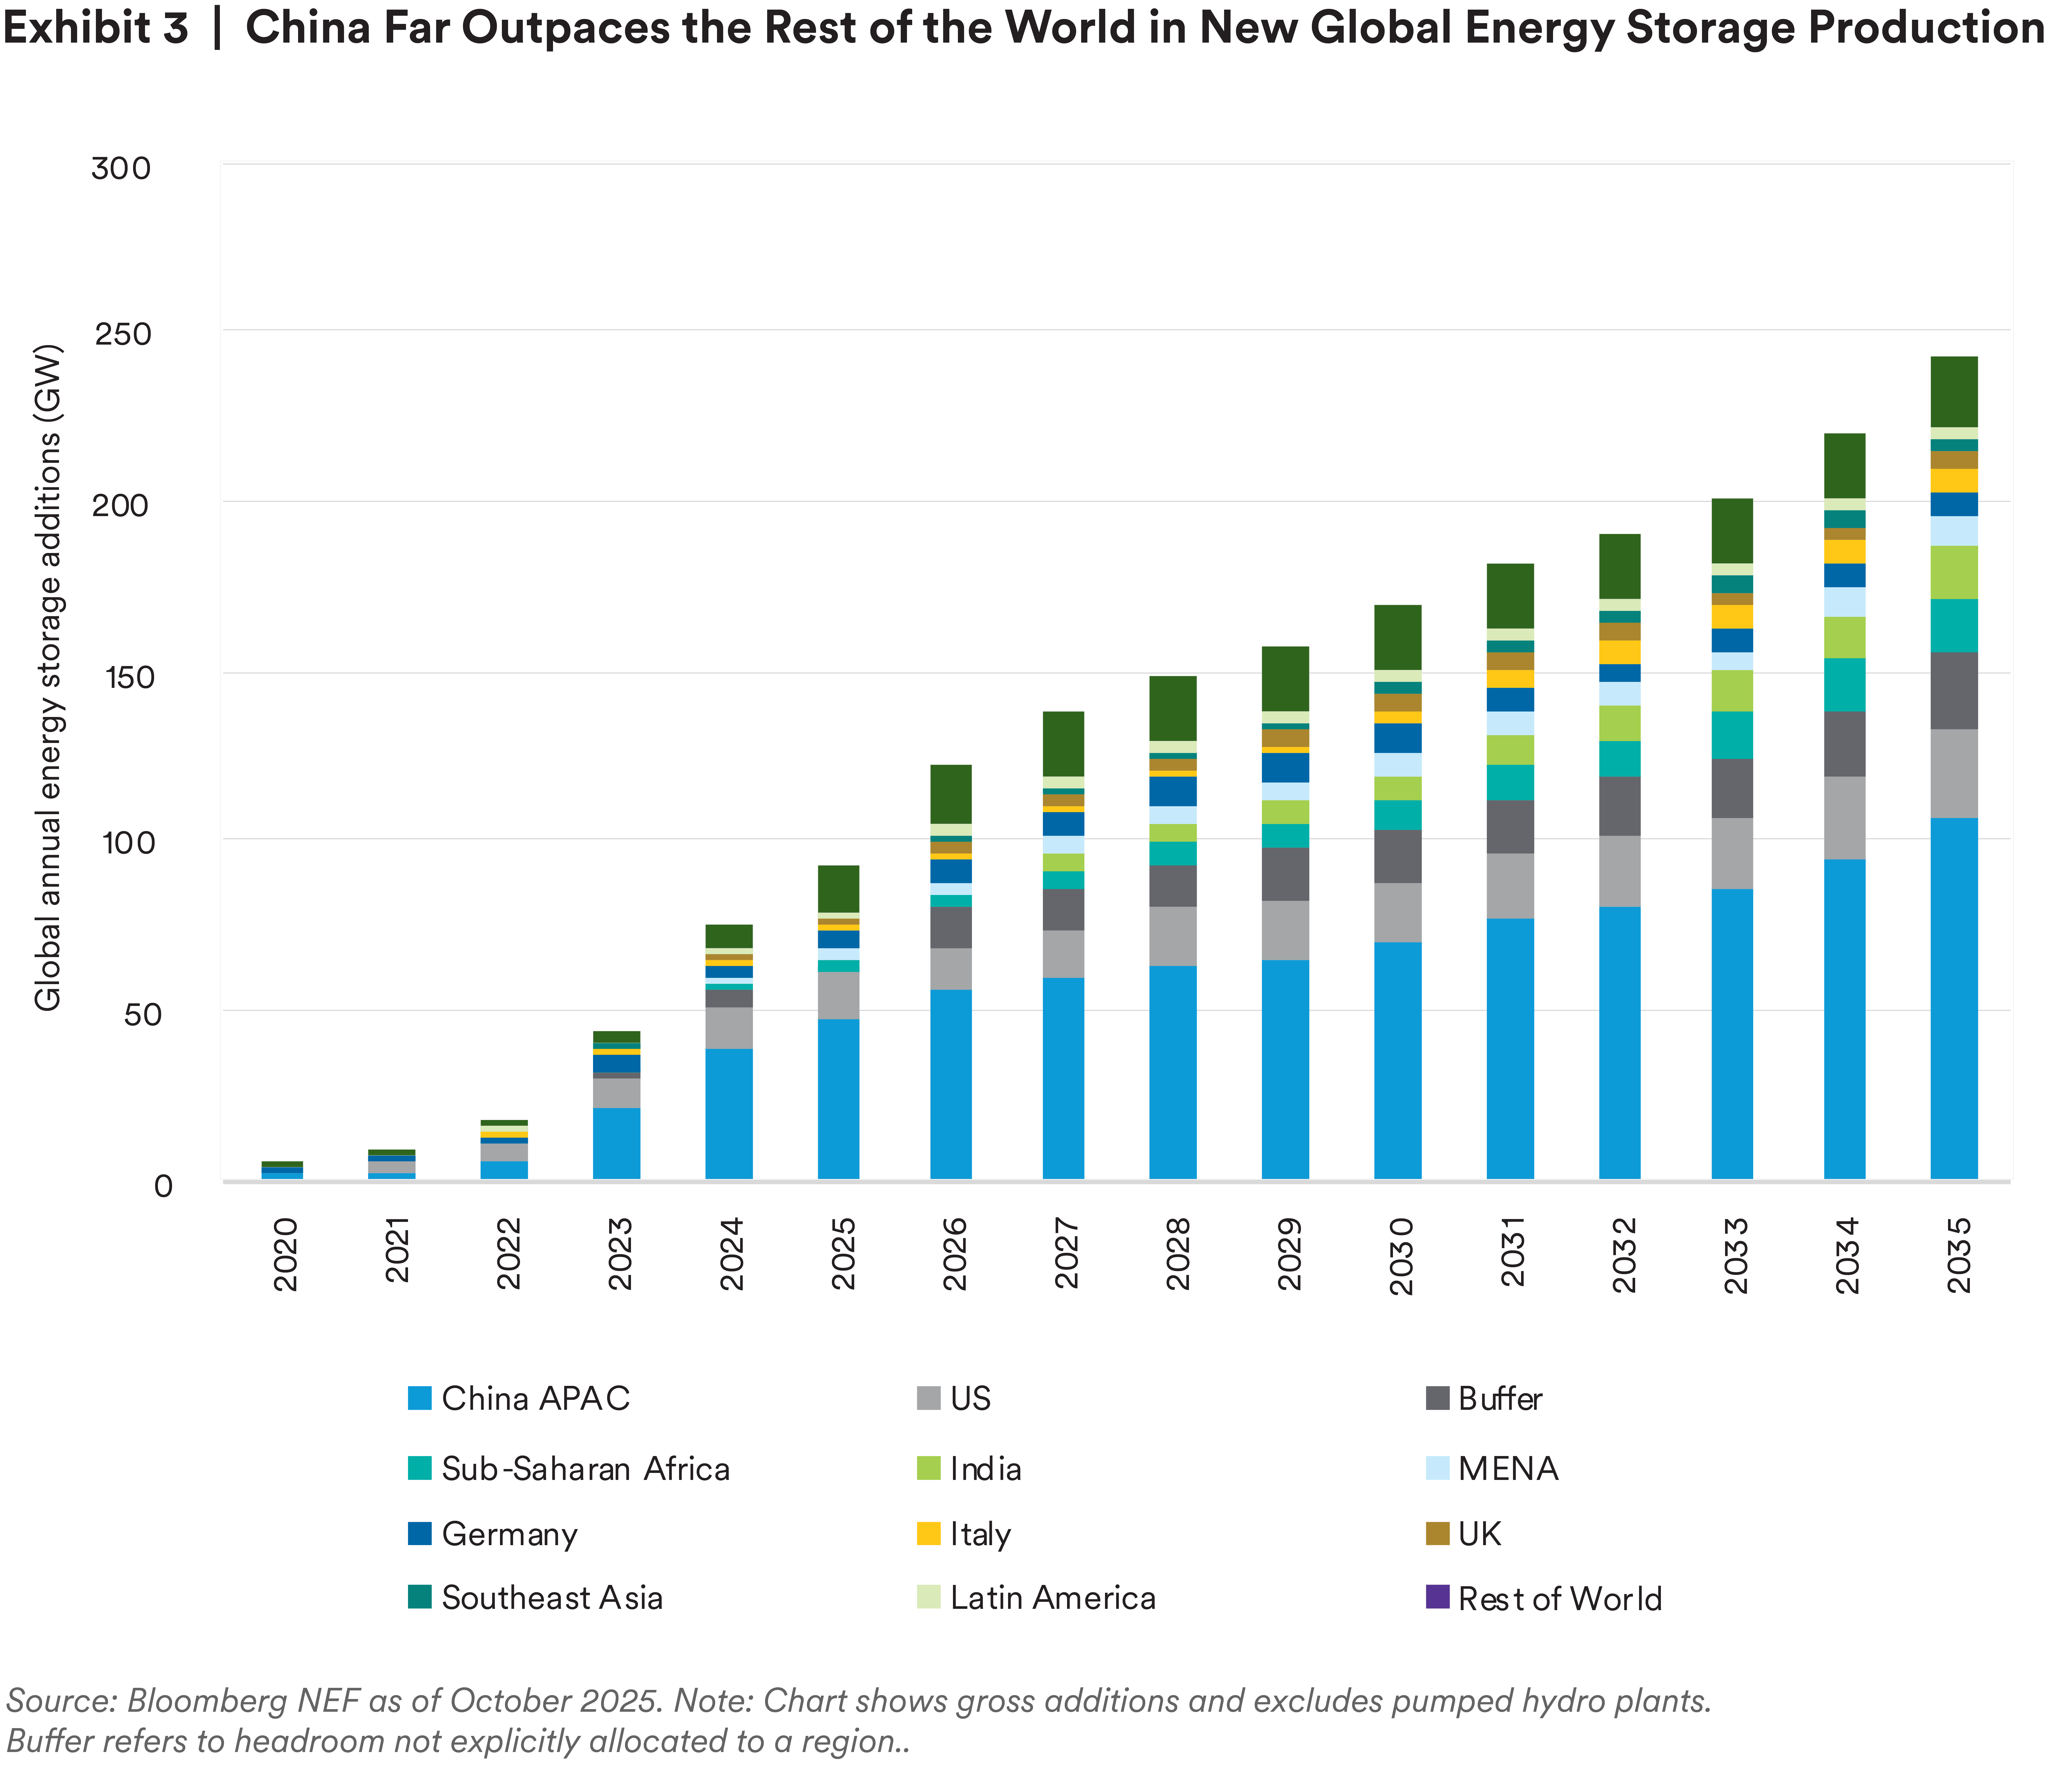
In 2025, China’s combined operating wind, utility-scale solar and distributed solar capacity surpassed 1.6 TW, triple the combined capacity of its closest peers, the United States and India. The growth in 2025 represents a significant acceleration compared to previous years: China's wind and solar project pipeline expanded from 1.2 TW in 2024 to 1.5 TW in 2025, while the pipeline in G7 nations remained mostly flat.21 Beyond generation, installed battery and pumped hydropower storage capacity reached 213 GW in 2025, with battery storage capacity up 52%, year on year, and grid investment rising 6% to an all-time high of $90 billion (Exhibit 3).22 This growth has provided the conditions for the power sector to continue an 18-month trend of plateauing GHG emissions.23
China has also emerged as the dominant global force in clean technology manufacturing. In 2024, China produced approximately 80% of the world's solar modules and battery cells, over two-thirds of its electric vehicles, and more than half of global heat pumps.24 It is also the top refiner for nearly all major critical minerals, accounting for an average market share of around 70%.25 This manufacturing dominance has occurred alongside dramatic cost reductions for renewables globally.
While China has driven the expansion and cost reduction in technologies that are critical for the energy transition, the country’s dominance may also amplify supply - chain concentration risk, trade tensions, exposures to tariffs and growing concerns around energy security and industrial policy from countries importing their products. How sovereigns and private sector actors perceive these risks going forward will be an important factor in China’s continuing role in the energy transition.
The regional dynamics driving the energy transition are shifting. China remains the world’s largest energy transition investor, as discussed in detail in the previous section, but it recorded its first slowdown in over a decade in 2025. In contrast, investment accelerated elsewhere, with the United States growing steadily (+4% year on year) and Europe expanding materially (+18% year on year). Overall, these trends point to a rebalancing of growth within a rapidly expanding global market, supported by improving cost competitiveness and strong structural demand for power solutions.26
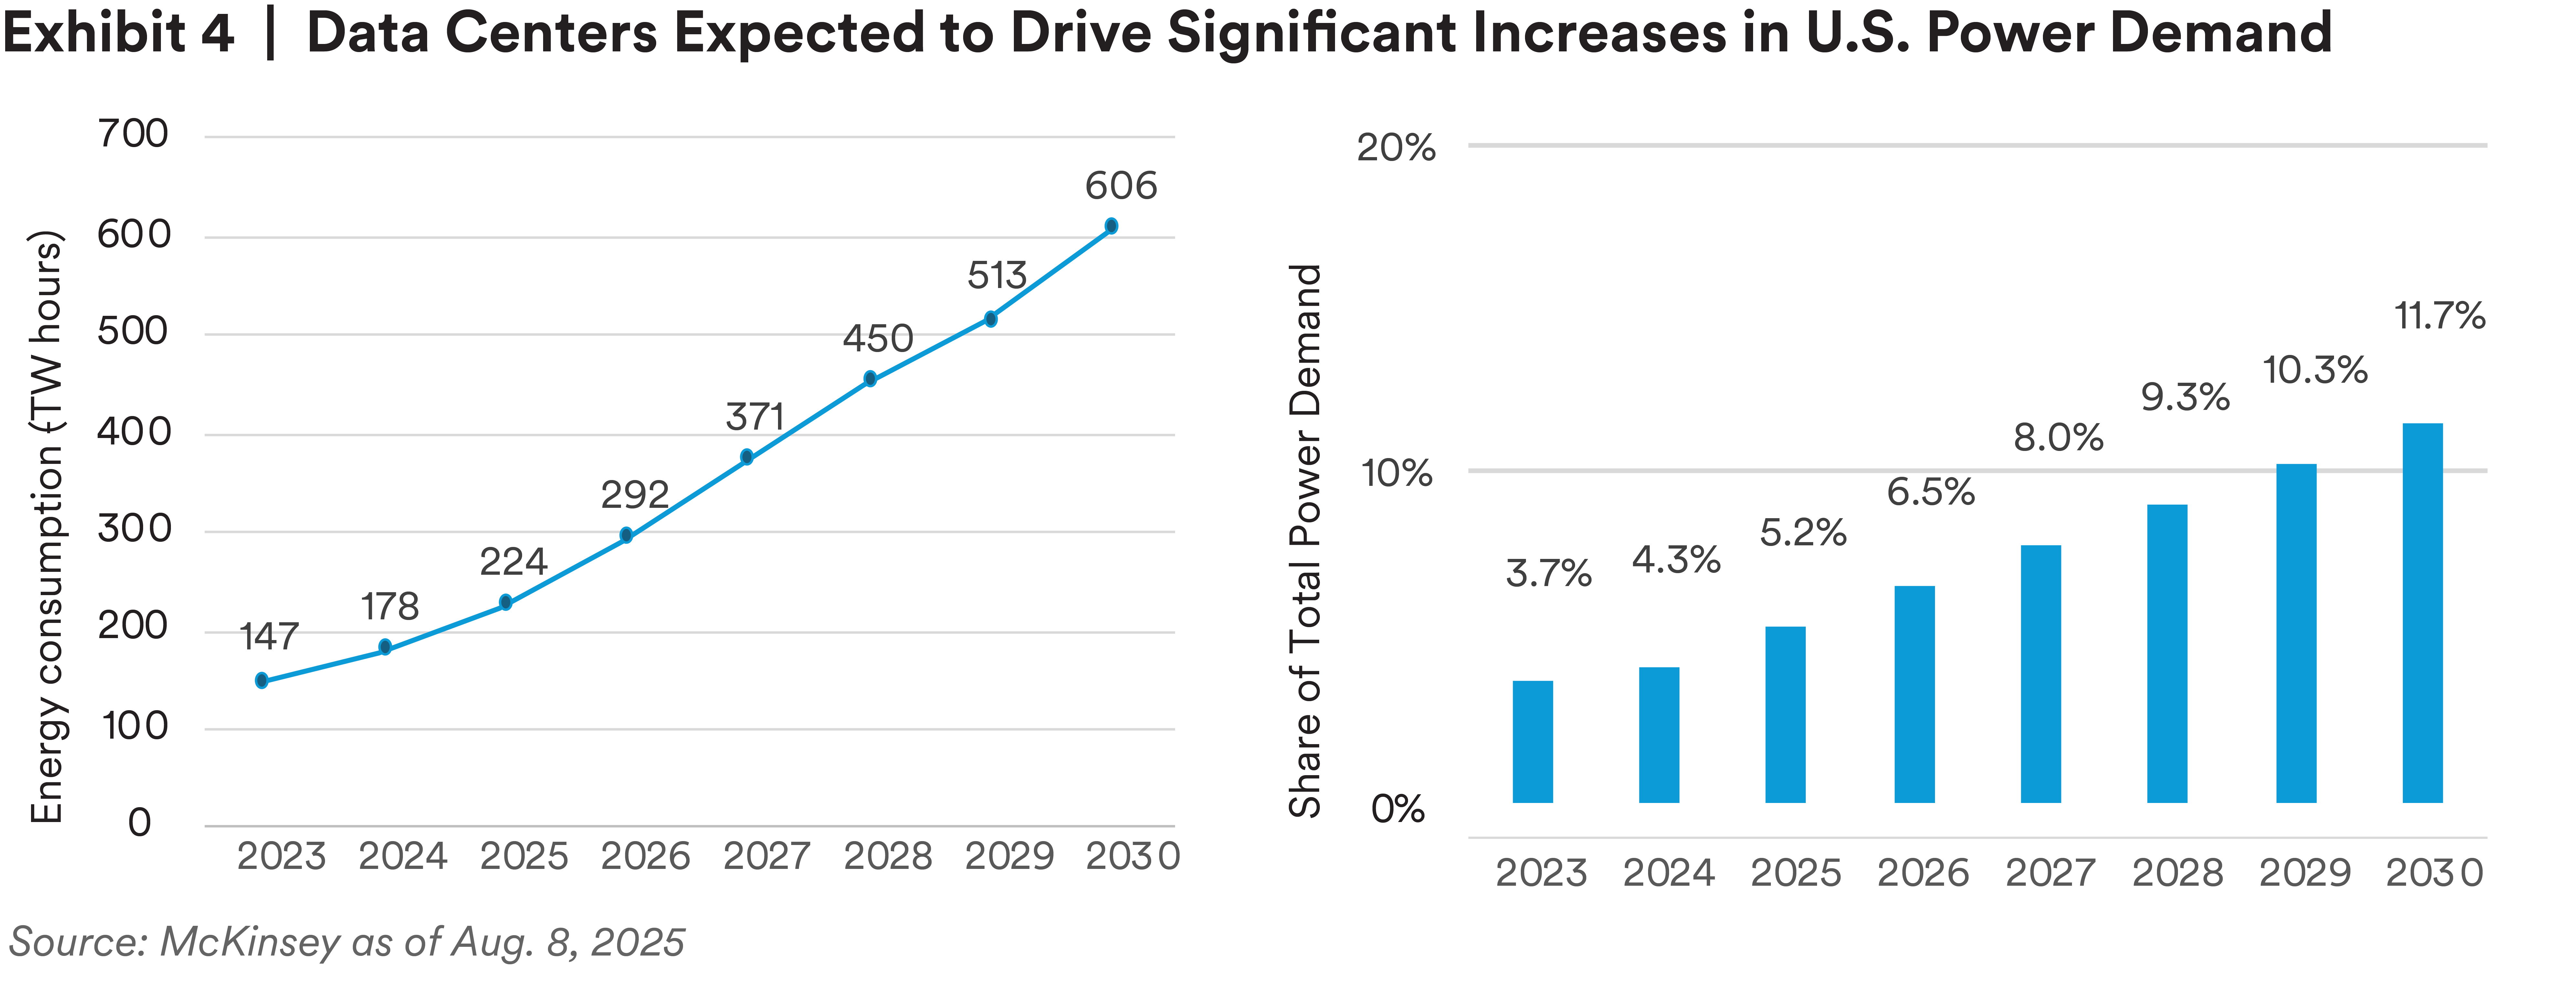
In the United States, structurally higher power demand from data centers, electrification and industrial reshoring is tightening reserve margins and driving renewed demand for firm and dispatchable capacity across gas, storage and various hybrid solutions (Exhibit 4). We at MIM believe the next phase of energy transition will be defined less by the availability of technology than by the feasibility of execution. The durability and reliability of federal and state energy policies is key to encouraging investment. And while capital markets remain open for renewables and storage, deployment at scale is increasingly constrained by lengthy interconnection queues, transmission bottlenecks and challenges related to permitting, commercial contracting and capital formation. How quickly these obstacles are opened up will inform the pace of grid modernization and building new generation capacity. From a credit perspective, these dynamics reinforce investors’ preference for assets with highly contracted and predictable revenue streams, as well as sponsor platforms with a demonstrated ability to navigate development and construction risk.
In Europe, renewable energy generation remains a core pillar of the private infrastructure asset class, complemented by attractive opportunities in transmission and distribution assets that are critical to system resilience. While standalone battery storage continues to face challenges in raising debt financing from non-bank lenders, we expect regulatory frameworks and revenue mechanisms, such as capacity payments, to evolve in ways that better support private capital deployment. Although selective opportunities have emerged in both greenfield and brownfield nuclear generation, the overall pipeline remains relatively limited at present. Looking ahead, additional investment opportunities are expected to arise in adjacent segments of the energy transition, including electric vehicle charging infrastructure.
The energy transition is progressing unevenly, with unprecedented expansion in key markets and technologies and stalled progress in others. The defining feature of the next phase of the energy transition is the shift from technology-led growth to execution-led outcomes. While capital availability and technological viability have largely been established across many segments, the ability to deliver projects on time and within budget under evolving regulatory frameworks has become a primary determinant of investment success. Investor behavior increasingly reflects this shift, with a premium placed on assets and platforms that continue to demonstrate execution certainty.
MetLife Investment Management (MIM) is a leading infrastructure investor, with over $42 billion in investments across a broad range of projects and sectors. As a global institutional asset manager, our approach takes a long-term view on the drivers of opportunity and change within the energy system and the broader economy. We currently invest across a broad opportunity set within the energy transition, including renewable energy assets, grid infrastructure and electrified transport, among others. Additionally, MIM’s Transition Strategy currently deployed within private credit and public fixed income strategies — offers an opportunity for investors to invest in the energy transition through a whole economy approach.
Endnotes
1 Bloomberg NEF. “Energy Transition Investment Trends.” February 2026.
2 Albert Cheung. “Progress Despite Fragmentation: The Energy Transition to 2030.” Bloomberg NEF. Jan. 6, 2026.
3 Nicholas Fulghum and Rashmi Mishra. “Highlights of the Global Energy Transition in 2025.” Ember. Dec. 17, 2025.
4 Champlain Hudson Power Express website. May 2026.
5 2024: nearly 50% of EU electricity came from renewables | Eurostat
6 2024: nearly 50% of EU electricity came from renewables | Eurostat
7 Albert Cheung. “Progress Despite Fragmentation: The Energy Transition to 2030.” Bloomberg NEF. Jan. 6, 2026.
8 International Energy Agency. “Global Energy Investment Set to Rise to $3.3 trillion 2025 amid Economic Uncertainty and Energy Security Concerns.” June 5, 2025.
9 Halcyon and Benchmark Mineral Intelligence cited by Nat Bullard. “Decarbonization: Parameters, Dollars and Sense, Electrons Photons Molecules.” Slide 104, Jan. 15, 2026.
10 California Energy Commission. “News Release: California’s Battery Storage Fleet Continues Record Growth, Strengthening Grid Reliability.” November 13, 2025.
11 World Steel Association. “Climate Change and the Production of Iron and Steel – 2025.”
12 Vardah Gill. “Cleveland-Cliffs Cancels $500M Hydrogen Steel Plant Project in Ohio.” Insider Monkey. Kime 5. 2025.
13 Reuters. “ArcelorMittal Drops Plans for Green Steel in Germany Due to High Energy Costs.” June 20, 2025.
14 Eurometal. “ArcelorMittal cancels DRI-EAF decarbonization investment in Germany.” June 23, 2025.
15 Angus Leslie Melville. “IJGlobal ESG Energy Transition – Shipping.” Green Street Infrastructure. Oct. 17, 2024.
16 Southern Indiana Business Report. “DOE Cancels $500 Million Award for Heidelberg’s Carbon Capture Project at Mitchell Plant.” June 5, 2025.
17 Alexander Kaufman. “Exxon Halts Plans for Massive Low-Carbon Hydrogen Facility in Texas.” Canary Media, Dec. 1, 2025.
18 Halina Yermolenko. “Major Pause in EU Steel Industry Decarbonization Projects.” GMK Center, Oct. 8, 2025.
19 Lauri Myllyvirta and Belinda Schaepe. “Analysis: Clean Energy Drove More than a Third of China’s GDP Growth in 2025.” CarbonBrief, February 5, 2026.
20 Muyi Yang, et al. “China Energy Transition Review.” Ember, Sept. 9, 2025.
21 Diren Kocakuşak and Mengqi Zhang. “Global Wind and Solar 2025: The G7 Gap.” Global Energy Monitor, February 2026.
22 Lauri Myllyvirta and Belinda Schaepe. “Analysis: Clean Energy Drove More than a Third of China’s GDP Growth in 2025.” CarbonBrief, Feb. 5, 2026.
23 Lauri Myllyvirta. “Analysis: China’s CO2 Emissions Have Now Been Flat or Falling for 18 Months.” Carbon Brief, Dec. 11, 2025.
24 Muyi Yang, et al. “China Energy Transition Review.” Ember, Sept. 9, 2025.
25 International Energy Agency. “Diversification Is the Cornerstone of Energy Security of Energy Security, Yet Critical Minerals Are Moving in the Opposite Direction.” May 21, 2025.
26 Bloomberg NEF. “Energy Transition Investment Trends.” February 2026.
Disclosure
This material is intended solely for Institutional Investors, Qualified Investors and Professional Investors. This analysis is not intended for distribution with Retail Investors.
MetLife Investment Management (MIM), which includes PineBridge Investments, is MetLife Inc.’s institutional investment management business. MIM is a group of international companies that provides investment advice and markets asset management products and services to clients around the world.
This document is solely for informational purposes and does not constitute a recommendation regarding any investments or the provision of any investment advice, or constitute or form part of any advertisement of, offer for sale or subscription of, solicitation or invitation of any offer or recommendation to purchase or subscribe for any securities or investment advisory services. The views expressed herein are solely those of MIM and do not necessarily reflect, nor are they necessarily consistent with, the views held by, or the forecasts utilized by, the entities within the MetLife enterprise that provide insurance products, annuities and employee benefit programs. The information and opinions presented or contained in this document are provided as of the date it was written. It should be understood that subsequent developments may materially affect the information contained in this document, which none of MIM, its affiliates, advisors or representatives are under an obligation to update, revise or affirm. It is not MIM’s intention to provide, and you may not rely on this document as providing, a recommendation with respect to any particular investment strategy or investment. Affiliates of MIM may perform services for, solicit business from, hold long or short positions in, or otherwise be interested in the investments (including derivatives) of any company mentioned herein. This document may contain forward-looking statements, as well as predictions, projections and forecasts of the economy or economic trends of the markets, which are not necessarily indicative of the future. Any or all forward-looking statements, as well as those included in any other material discussed at the presentation, may turn out to be wrong.
The various global teams referenced in this document, including portfolio managers, research analysts and traders are employed by the various legal entities that comprise MIM.
All investments involve risks including the potential for loss of principle and past performance does not guarantee similar future results.
For investors the U.S.: This document is communicated by MetLife Investment Management, LLC (MIM, LLC), a U.S. Securities and Exchange Commission (SEC) registered investment adviser. Registration with the SEC does not imply a certain level of skill or that the SEC has endorsed the investment adviser.
For investors in the UK: This document is being distributed by MetLife Investment Management Limited (“MIML”), authorised and regulated by the UK Financial Conduct Authority (FCA reference number 623761), registered address One Angel Lane 8th Floor London EC4R 3AB United Kingdom. This document is approved by MIML as a financial promotion for distribution in the UK. This document is only intended for, and may only be distributed to, investors in the UK who qualify as a “professional client” as defined under the Markets in Financial Instruments Directive (2014/65/EU), as per the retained EU law version of the same in the UK.
For investors in the Middle East: This document is directed at and intended for institutional investors (as such term is defined in the various jurisdictions) only. The recipient of this document acknowledges that (1) no regulator or governmental authority in the Gulf Cooperation Council (“GCC”) or the Middle East has reviewed or approved this document or the substance contained within it, (2) this document is not for general circulation in the GCC or the Middle East and is provided on a confidential basis to the addressee only, (3) MetLife Investment Management is not licensed or regulated by any regulatory or governmental authority in the Middle East or the GCC, and (4) this document does not constitute or form part of any investment advice or solicitation of investment products in the GCC or Middle East or in any jurisdiction in which the provision of investment advice or any solicitation would be unlawful under the securities laws of such jurisdiction (and this document is therefore not construed as such).
For investors in Japan: This document is being distributed by MetLife Investment Management Japan, Ltd. (“MIM JAPAN”), a registered Financial Instruments Business Operator (“FIBO”) conducting Investment Advisory Business, Investment Management Business and Type II Financial Instruments Business under the registration entry “Director General of the Kanto Local Finance Bureau (Financial Instruments Business Operator) No. 2414” pursuant to the Financial Instruments and Exchange Act of Japan (“FIEA”), and a regular member of the Investment Management Association of Japan and the Type II Financial Instruments Firms Association of Japan. In its capacity as a discretionary investment manager registered under the FIEA, MIM JAPAN provides investment management services and also sub-delegates a part of its investment management authority to other foreign investment management entities within MIM in accordance with the FIEA. This document is only being provided to investors who are general employees’ pension fund based in Japan, business owners who implement defined benefit corporate pension, etc. and Qualified Institutional Investors domiciled in Japan. It is the responsibility of each prospective investor to satisfy themselves as to full compliance with the applicable laws and regulations of any relevant territory, including obtaining any requisite governmental or other consent and observing any other formality presented in such territory. As fees to be borne by investors vary depending upon circumstances such as products, services, investment period and market conditions, the total amount nor the calculation methods cannot be disclosed in advance. All investments involve risks including the potential for loss of principle and past performance does not guarantee similar future results. Investors should obtain and read the prospectus and/or document set forth in Article 37-3 of Financial Instruments and Exchange Act carefully before making the investments.
For Investors in Hong Kong S.A.R.: For Investors in Hong Kong S.A.R. MetLife Investment Management and PineBridge Investments operate through the following entities: MetLife Investments Asia Limited (“MIAL”), licensed by the Securities and Futures Commission (“SFC”) for Type 1 (dealing in securities), Type 4 (advising on securities) and Type 9 (asset management) regulated activities, PineBridge Investments Asia Limited licensed by the SFC for Type 1 (dealing in securities), Type 4 (advising on securities) and Type 9 (asset management) regulated activities, and PineBridge Investments Hong Kong Limited licensed by the SFC for Type 1 (dealing in securities) and Type 9 (asset management) regulated activities. Unless otherwise stated, none of the authors of this article, interviewees or referenced individuals are licensed by the SFC to carry on regulated activities in Hong Kong S.A.R. The information contained in this document is for information purposes only and it has not been reviewed by the Securities and Futures Commission.
This document may also be distributed by certain PineBridge Investments affiliates acquired by MetLife Investment Management on December 30, 2025. For additional legal and regulatory disclosures including other cross border information, please refer to https://www.pinebridge.com/en/regulatory-disclosure.
For investors in Australia: This information is distributed by MIM LLC and is intended for “wholesale clients” as defined in section 761G of the Corporations Act 2001 (Cth) (the Act). MIM LLC exempt from the requirement to hold an Australian financial services license under the Act in respect of the financial services it provides to Australian clients. MIM LLC is regulated by the SEC under US law, which is different from Australian law.
For investors in the EEA: This document is being distributed by MetLife Investment Management Europe Limited (“MIMEL”), authorised and regulated by the Central Bank of Ireland (registered number: C451684), registered address 20 on Hatch, Lower Hatch Street, Dublin 2, Ireland. This document is approved by MIMEL as marketing communications for the purposes of the EU Directive 2014/65/EU on markets in financial instruments (“MiFID II”). Where MIMEL does not have an applicable cross-border licence, this document is only intended for, and may only be distributed on request to, investors in the EEA who qualify as a “professional client” as defined under MiFID II, as implemented in the relevant EEA jurisdiction. The investment strategies described herein are directly managed by delegate investment manager affiliates of MIMEL. Unless otherwise stated, none of the authors of this article, interviewees or referenced individuals are directly contracted with MIMEL or are regulated in Ireland. Unless otherwise stated, any industry awards referenced herein relate to the awards of affiliates of MIMEL and not to awards of MIMEL.