Treasuries / Agencies
- Volatility remains high around key data releases (especially inflation and employment)
- We expect the Federal Reserve will be inclined towards adjusting tapering quantitative tightening this summer
- With anticipated timing of the first rate cut having been pushed back, we expect continued curve steepening in the coming months driven by front-end rates declining and long-term yields range bound or moving higher
ABS
- ABS spreads have moved tighter despite heavy new issue supply
- Continued deterioration in trust performance metrics expected
- We continue to favor liquid, defensive tranches from credit card and prime auto issuers as well as equipment deals
CMBS
- CMBS spreads have tightened despite negative headlines and rising delinquencies
- New issue supply remains muted as higher rates, tighter lending standards and negative sentiment weigh on refinancings
- At current spreads, we are inclined to sell agency CMBS and are becoming even more selective in conduit tranches
RMBS
- Mortgages posted negative excess returns in the first quarter (Bloomberg)
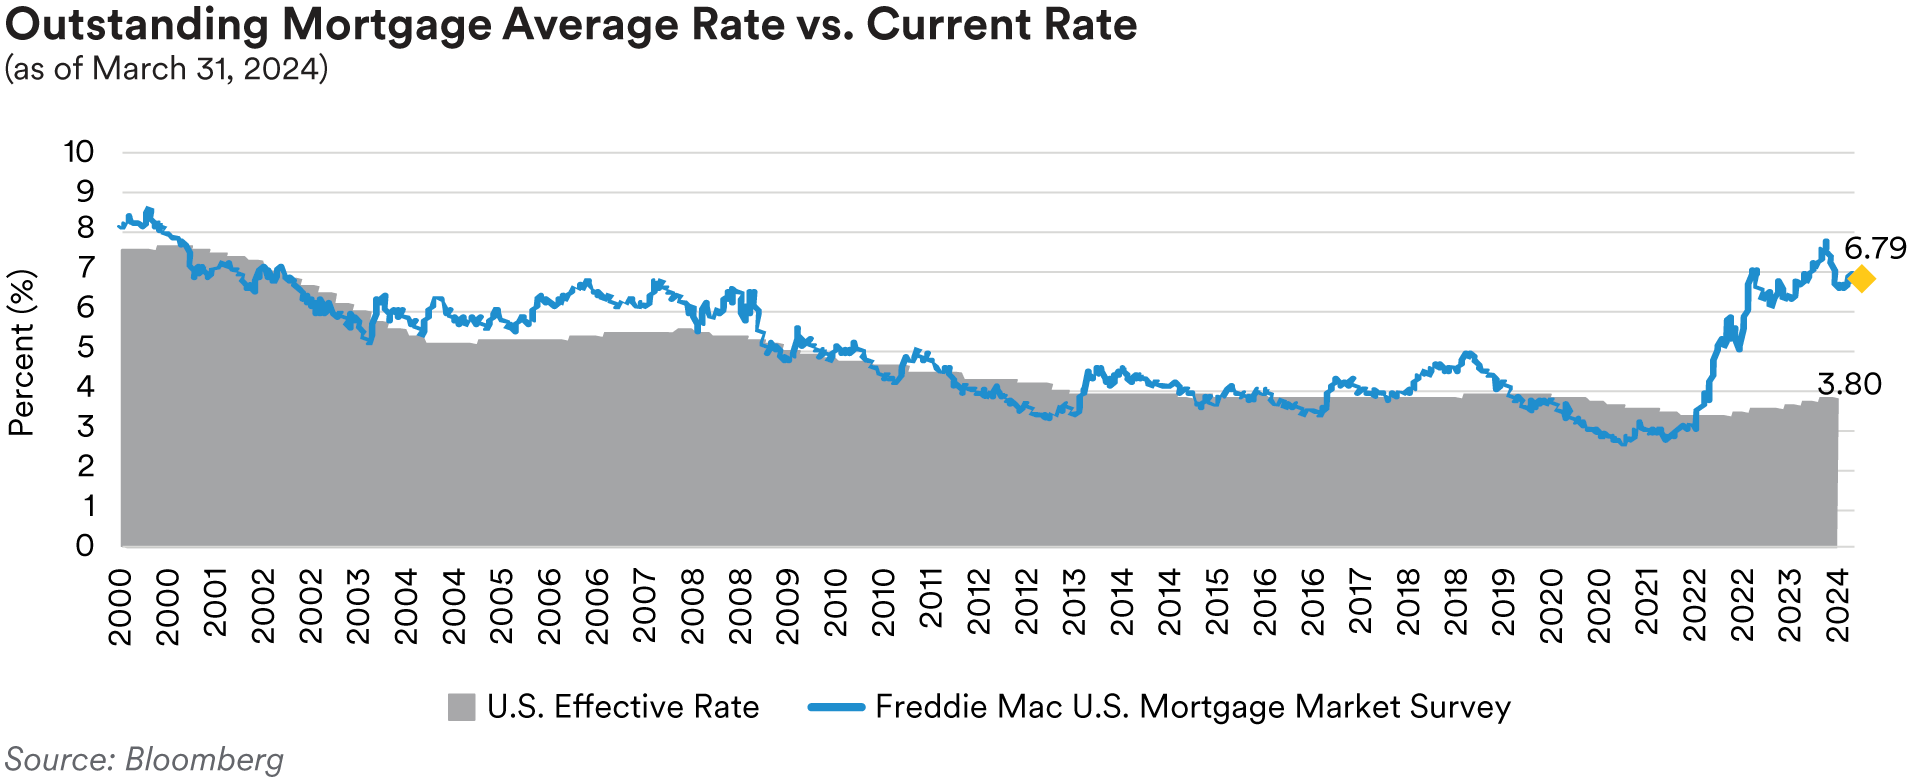
- At current mortgage rates, most outstanding mortgages remain outside of the refinancing window so prepayments are likely to remain low (Bloomberg, Freddie Mac)
- We still find value in single-family rental (SFR) tranches which are supported by favorable housing market dynamics
Municipals
- Municipal issuer credit fundamentals have remained resilient
- After two years of tax revenue growth, states have lowered their expectations for fiscal-year 2024
- We will continue to selectively add to the municipal sector as a defensive alternative to other spread sectors
Investment Grade Credit
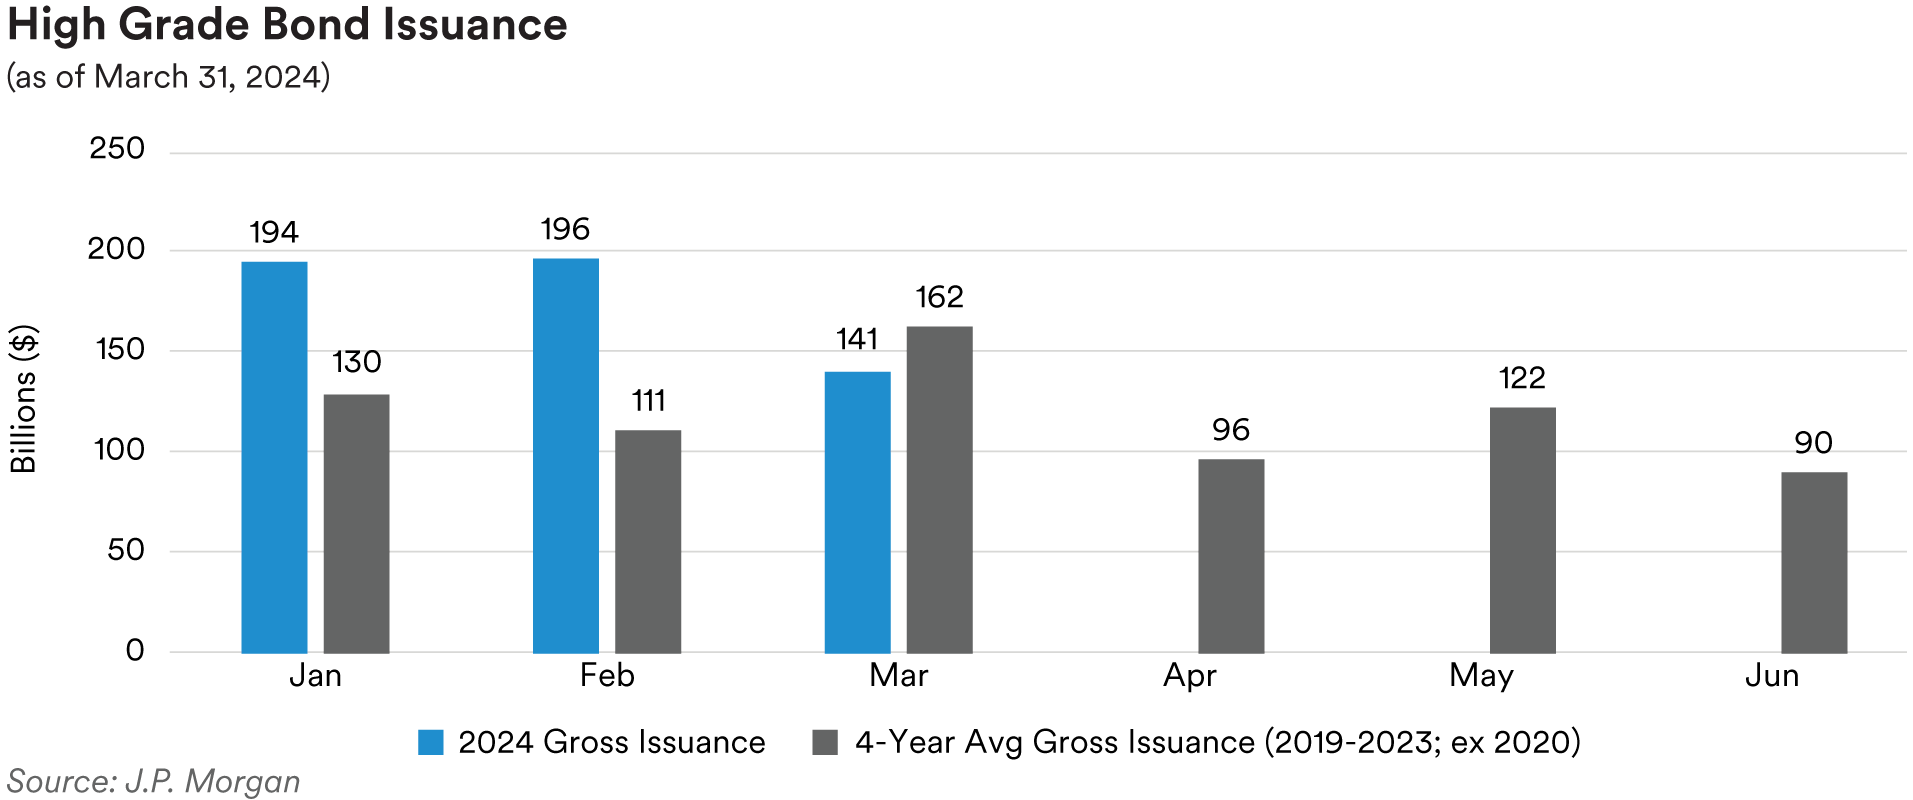
Recap: The investment grade credit market began the year with a strong performance in the first quarter best evidenced by three straight months of positive excess returns as spreads maintained their grind tighter, following the very strong relative returns posted in November and December. This came against a backdrop of easing financial conditions, some global equity indices reaching all-time highs, rising Treasury yields, and a robust corporate new issue calendar that helped investors scrambling to put money to work to lock in attractive all-in yields. The timing or kick-off in fed-funds rate cuts has kept getting pushed further out into the future with the market initially projecting it beginning in March, but persistently resilient U.S. economic growth and labor market indicators have enabled what felt last year like the most widely anticipated recession in history as the Federal Reserve ratcheted their policy rate higher to morph into a market consensus call for a soft or no landing. Relative stability in corporate credit fundamentals albeit with mild erosion observed in selected subsectors has allowed market technicals to predominate, permitting investors to capture near decade plus-high, front-end all-in yields even as valuations have become less and less attractive with the grind tighter in spreads. The dynamic of unrelentingly hardy new issue corporate bond supply, as seen in first quarter issuance surpassing $540 billion, the highest quarterly amount on record, being met by continued strong demand from domestic and foreign investors prevailed throughout the quarter despite less favorable data on inflation, jobs and other barometers of economic growth. The market has seemingly shrugged off continued geopolitical risks centered on the war in Ukraine and conflict in the Middle East with complacency seemingly growing.
Relative stability in corporate credit fundamentals albeit with mild erosion observed in selected subsectors has allowed market technicals to predominate, permitting investors to capture near decade plus-high, front-end all-in yields even as valuations have become less and less attractive with the grind tighter in spreads. The dynamic of unrelentingly hardy new issue corporate bond supply, as seen in first quarter issuance surpassing $540 billion, the highest quarterly amount on record, being met by continued strong demand from domestic and foreign investors prevailed throughout the quarter despite less favorable data on inflation, jobs and other barometers of economic growth. The market has seemingly shrugged off continued geopolitical risks centered on the war in Ukraine and conflict in the Middle East with complacency seemingly growing.
Returning briefly to fundamentals, fourth-quarter earnings reports, which printed throughout the first quarter, saw a second consecutive quarter of positive year-over-year earnings growth, though finishing with a low-single-digit growth print for S&P 500 Index companies. However, as tracked by J.P. Morgan, in terms of other credit and related metrics, fourth-quarter gross debt leverage continued to tick higher year-over-year, revenue growth was slightly negative, operating income as gauged by EBITDA declined, and interest expense coverage continued its slide due to the roll-off of lower coupons and higher refinancing yields. We will get further insight into corporate performance with the upcoming quarterly earnings season about to kick off in early April.
Portfolio Actions: Given our cautious market outlook and less than bullish view on the direction of credit spreads entering the year, we were very selective and strategic in where we looked to adjust our risk appetite or investment grade corporate sector exposure in the first quarter. In the Cash Plus strategy we added investment grade corporates to raise our sector weighting, primarily in one-year duration securities at what we deemed attractive yields, including purchasing secondary bonds of favored BBB issuers where permissible. It was a similar story in the Enhanced Cash strategy where we also sought to lock in higher yields for longer and bumped up our sector weighting but mainly focused on adding new issue and secondary two-year bonds at attractive yields funded in part by selling some short-dated 2024 maturity securities. In the 1-3 year strategy portfolios, we maintained our sector weighting relatively stable, selectively adding principally two- year in addition to a few three-year duration positions in some of our favored subsectors, skewed to higher-quality issuers and often tactically on rate backups to extend or keep portfolio durations in line with that of benchmark indices. These purchases were typically funded by selling bonds maturing inside a year. We also kept our sector weightings relatively constant over the quarter in the 1-5 year strategy portfolios, in like fashion selectively buying mainly higher-quality 3-5 year maturity new issues and secondaries on rate backups to lock in attractive yields for longer and nudge portfolio durations higher or keep them in line with benchmark indices. These buys were primarily offset with sales of less than one-year duration corporates.
Outlook: In the wake of the incremental spread tightening seen in the first quarter, corporate credit valuations remain on the rich side, not too far above post-GFC tights. Outside of the technology sector, where AI-driven enthusiasm has turbocharged revenue and earnings growth, and the commodities sector, corporate credit fundamentals, like the U.S. economy and labor market, remain resilient but continue to face headwinds and display mild erosion with leverage creeping higher and margins generally under pressure. Simply, attractive relative value in the sector broadly speaking is not overwhelmingly apparent. We remain very selective and see spreads as biased to widen from what we currently perceive to be somewhat stretched levels. The pockets of the market where we saw value such as U.S. money center and top-tier super-regional banks’ TLAC bonds earlier in the first quarter and selected new issue opportunities in insurance companies’ secured funding agreement-backed bonds, for example, have become less enticing. Looking ahead, we will continue to favor lower beta, less cyclically exposed subsectors and issuers tilted toward more up-in-quality names in maintaining our disciplined approach while also opportunistically participating in new issue offerings when we see relative value.
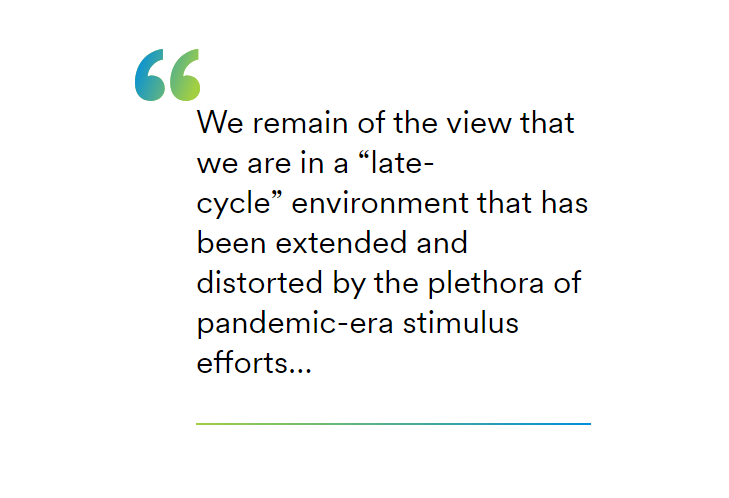
We anticipate maintaining a reduced investment grade credit sector weighting and spread duration compared to our historic norms, especially in our longer 1-3 year and 1-5 year strategies and will continue to be opportunistic in looking to lock in attractive yields on rate backups as we expect Treasury rates to be somewhat range-bound before eventually moving lower once economic growth shifts into a lower gear. We remain of the view that we are in a “late-cycle” environment that has been extended and distorted by the plethora of pandemic-era stimulus efforts for companies and consumers, a record amount of surplus cash accumulated, and sustained benefit of the previous period of near-zero interest rates. In the event the Fed is less successful in achieving victory in the battle over the last mile to win the inflation war toward the 2% target, forcing the Fed to maintain its policy rate higher for longer such that it tips the U.S. economy into a recession, we could see credit spreads reset meaningfully wider, eventually creating new opportunities. Thus, despite the market currently pricing in a rather benign end to the Federal Reserve’s hiking program or “soft landing” scenario, we anticipate the landscape, especially as it relates to corporate credit, could be more challenging as 2024 unfolds.
Performance: Across all strategies in the first quarter, the investment grade credit sector contributed positively to relative performance. Positive excess returns from the sector were driven by the credit spread tightening we saw each month. As noted above, corporates benefited over the quarter from sustained economic growth, mounting belief the U.S. may somehow avoid a recession this cycle, voracious investor demand due to robust inflows, and a renewed increase in Treasury yields.
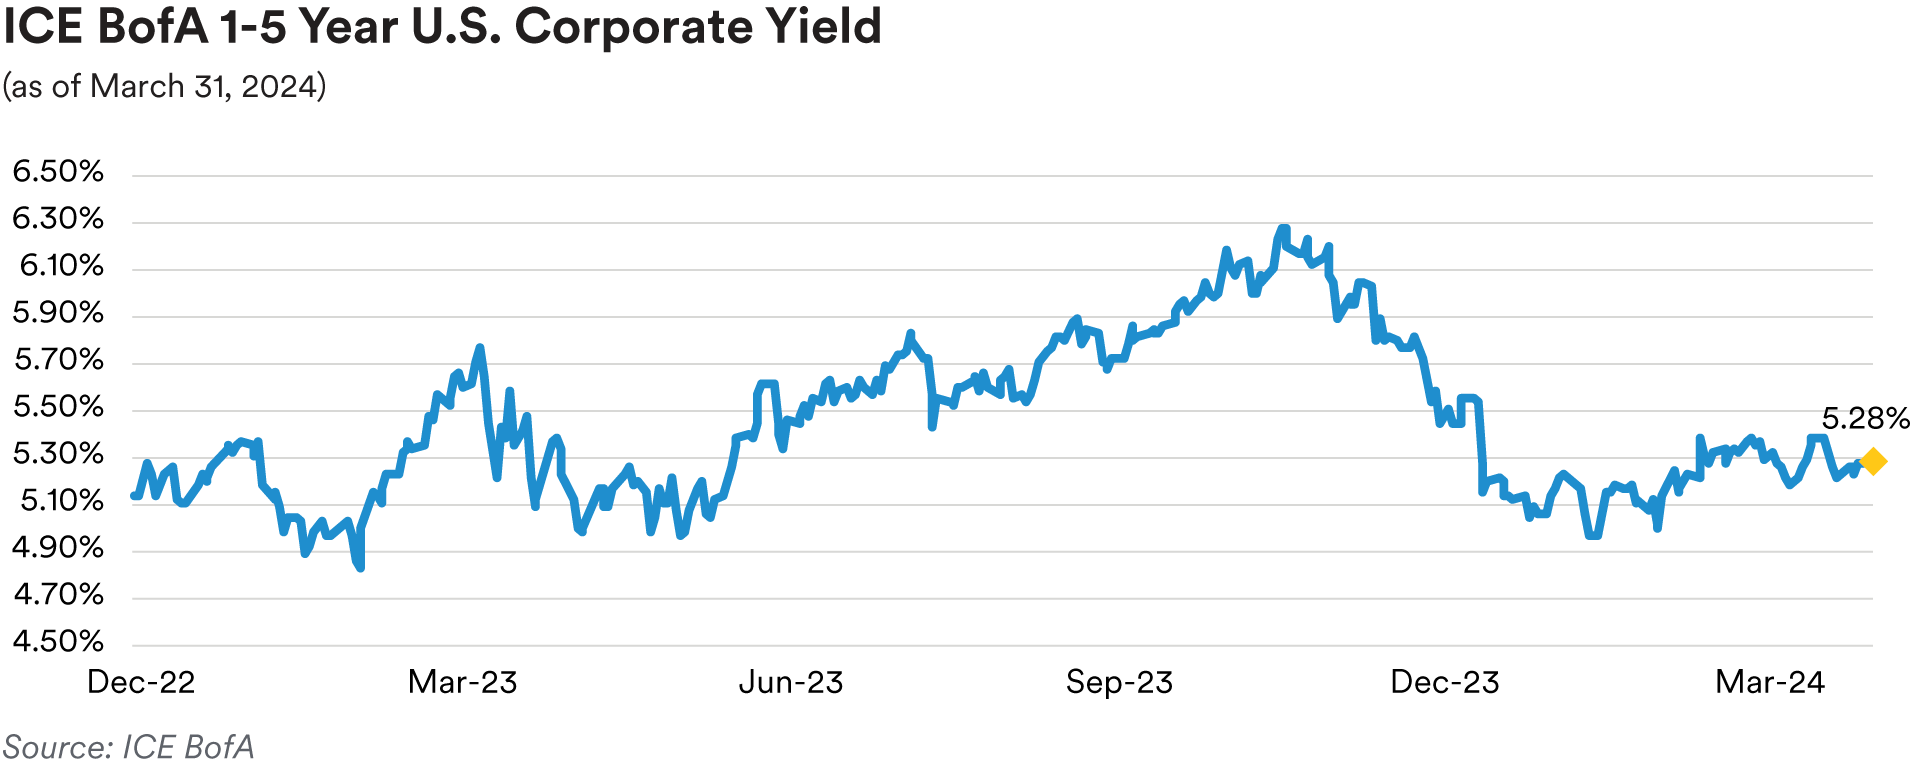
After the unusual move tighter in credit spreads in November and December coincident with a decline in Treasury yields, contrary to what typically occurs, markets reversed course in the first quarter and returned to the norm. Rising benchmark Treasury yields over the quarter were accompanied by tightening spreads. The OAS of our front-end benchmark ICE BofA 1-5 Year U.S. Corporate Index tightened 13 basis points during the quarter to 71 basis points, near the lowest level reached since February 2022. With the first quarter’s credit spread tightening and rise in benchmark yields, the index’s quarterly total return and excess return were 0.69% and 0.65%, respectively. Strongly performing investment grade credit subsectors that drove positive excess returns across strategies included Banking, Insurance, Automotive, Health Care, Pharmaceuticals and Electric Utilities.
Treasuries / Agencies
Recap: The Treasury market sold off in the first quarter as the markets repriced the number of expected quarter-point rate cuts for 2024 from seven to align with the Federal Reserve’s median projection of just three. Following the Fed’s December FOMC meeting, which many interpreted as quite dovish, markets priced in as many as seven rate cuts in 2024. That shifted dramatically following a slew of more hawkish Fedspeak over the past three months and two higher-than- forecast inflation prints and stronger economic data.
As expected, the March FOMC meeting saw the committee vote unanimously to keep the federal- funds policy rate unchanged at the 5.25% to 5.50% target range, a two-decade high, for a fifth straight meeting. Meanwhile, the median “dot plot” estimates for the fed-funds rate by the end of 2025 and 2026 were both revised up by 25 basis points to 3.875% and 3.125%, respectively. In addition, the median longer-term dot edged up slightly from 2.5% to 2.562%, implying rates will need to stay higher for longer in the future. The median forecast for PCE inflation, the Fed’s preferred gauge, was left unchanged at 2.4% for 2024 while the core PCE projection rose 0.2% to 2.6%; the GDP estimate for 2024 jumped to 2.1% from 1.4%. The Fed’s near-identical statement repeated previous language indicating the FOMC does not expect to cut rates “until it has gained greater confidence that inflation is moving sustainably toward 2%”. Federal Reserve officials, as anticipated, deliberated on easing the pace of their balance sheet reduction during their meeting. Powell indicated that this adjustment would commence “fairly soon,” clarifying that it will not accelerate the conclusion of the process but rather aim to facilitate a smoother transition for markets. This move is intended to mitigate the strains witnessed during the previous quantitative tightening phase or “taper tantrum”.
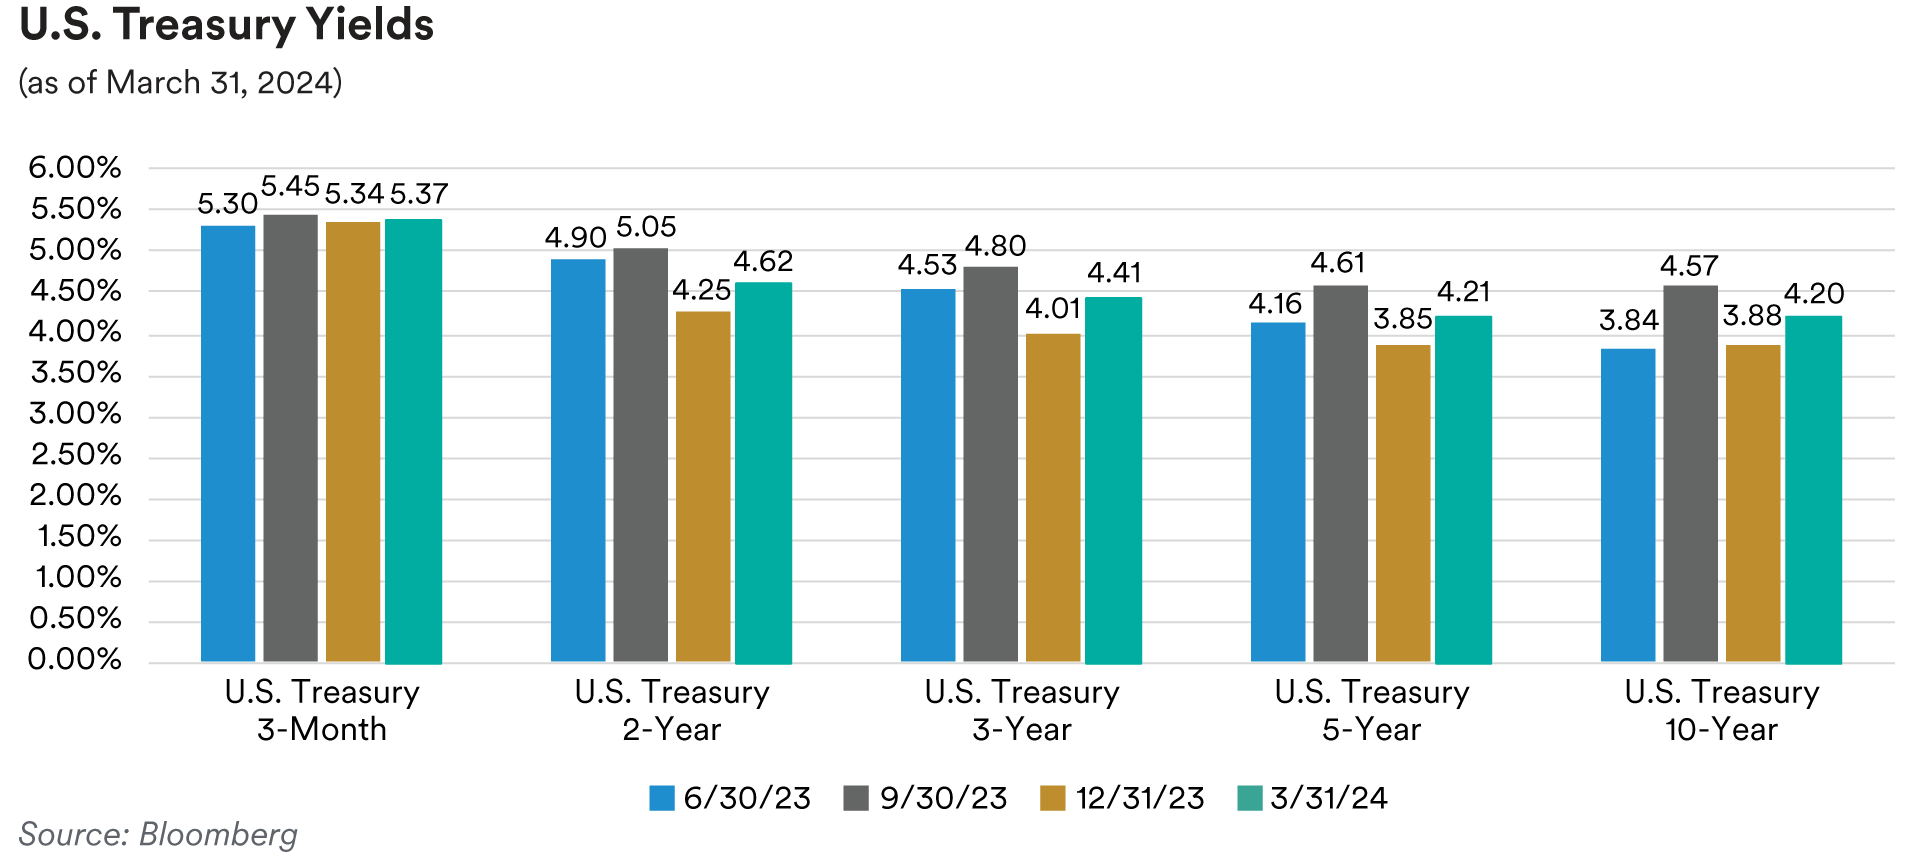
In the very front end of the market where we operate, short Treasury bill yields moved higher in tandem with what was observed across the rest of the yield curve over the first quarter. The three- month, six-month, and one-year bill yields were 3, 7 and 26 basis points higher during the quarter, respectively. The two-year Treasury moved 37 basis points higher, ending the quarter at 4.62%. The five-year Treasury also rose by 37 basis points and closed the quarter at 4.21% while the ten- year Treasury climbed 32 basis points higher to finish the quarter at 4.20%. The spread between the 10-year Treasury and the 2-year Treasury flattened further from -37 basis points at the start of the quarter to -42 basis points at the end of the quarter. The spread between the 5-year Treasury and 2-year Treasury moved marginally from -40 basis points at the start of the quarter to -41 basis points at the close of the quarter.
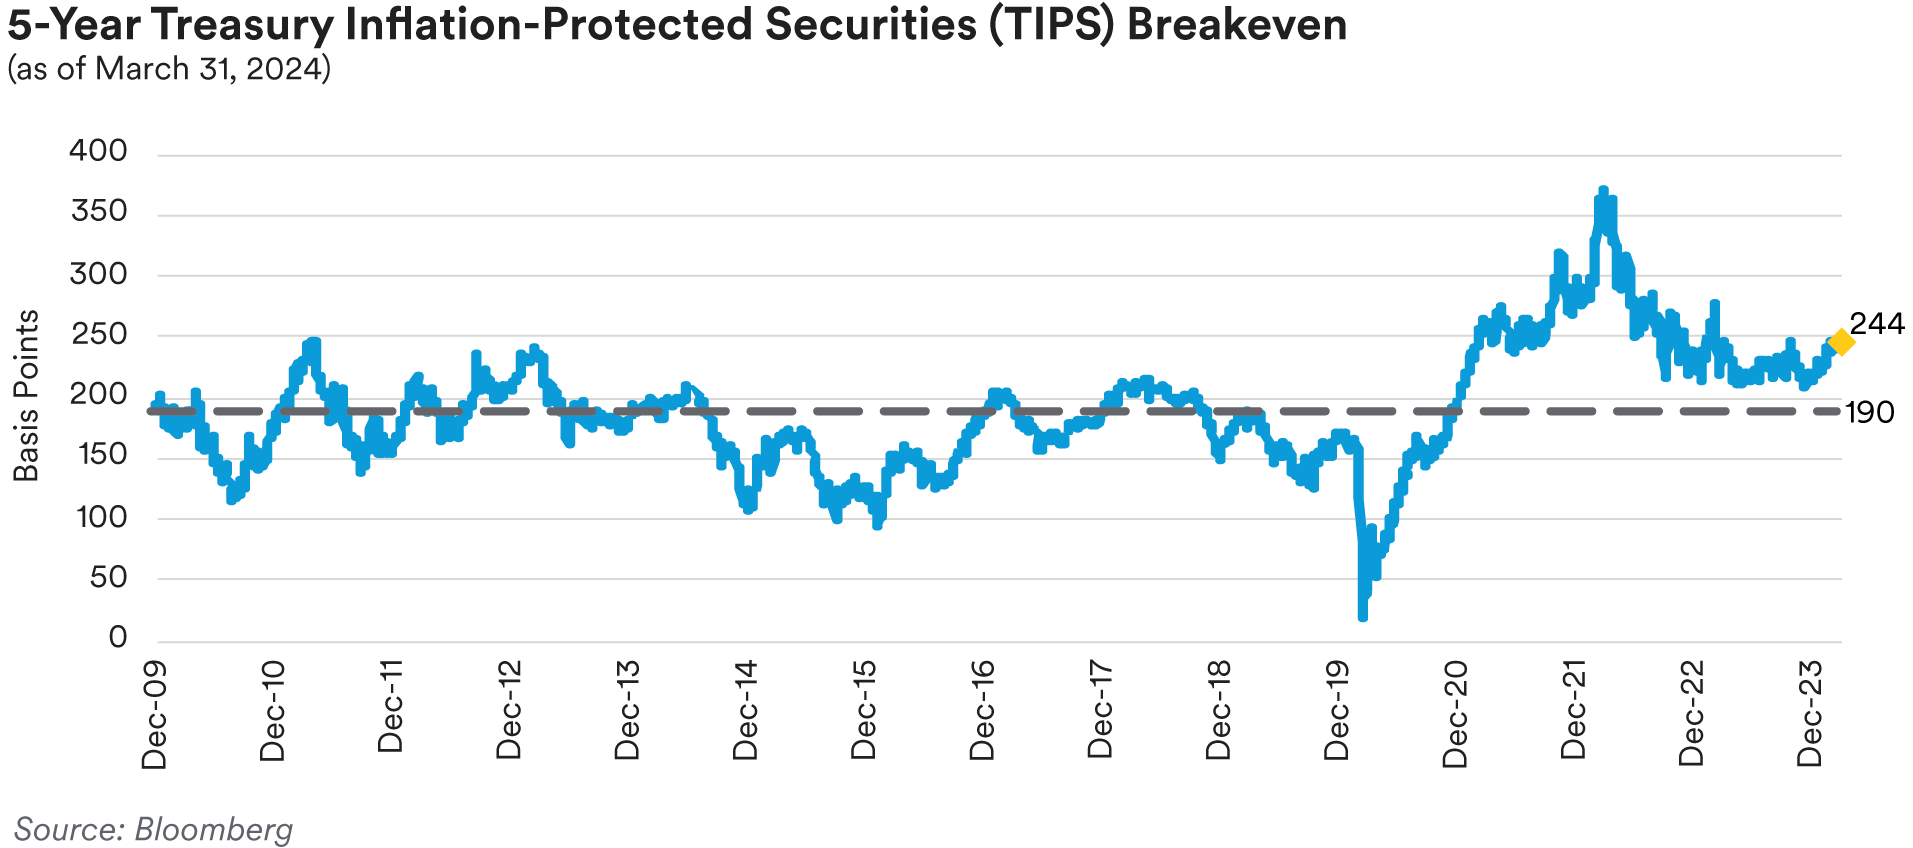
Treasury Inflation-Protected Securities (TIPS) breakeven inflation rates increased during the quarter. The five-year real yield went from 171 basis points at the beginning of the year to 181 basis points at the end of the quarter. The ten-year real yield moved from 171 basis points to 187 basis points over the quarter. Five-year TIPS breakeven rates climbed higher to 244 basis points from 215 basis points at the start of the quarter while the ten-year TIPS breakeven moved to 232 basis points from 217 basis points over the same period. During the quarter, we saw five and ten-year breakeven yields peak in late-March at 248 and 235 basis points, respectively.
Front-end Government-Sponsored Enterprise (GSE) agency spreads slightly widened over the first quarter as the OAS of the ICE BofA 1-5 Year U.S. Bullet (fixed maturity) Agency Index ended the quarter at 4 basis points, 3 basis points wider from the start of the year. In the SSA (Sovereigns, Supranationals & Agencies) subsector, U.S. dollar-denominated fixed-maturity security spreads were marginally tighter by 2 basis points and finished the quarter on average at 25 basis points over comparable-maturity Treasuries. Agency callable spreads relative to Treasuries tightened as short-dated and short-expiry volatility in the upper left portion of the volatility surface moved lower over the quarter. Two- and three-year maturity “Bermudan” callables, which feature quarterly calls with lockout periods of three months, saw spreads over Treasuries compress from 90 and 130 basis points at the start of the quarter to 75 and 110 basis points at the end of the quarter, respectively.
Portfolio Actions: In the first quarter, we continued to trim our allocation to Treasuries in favor of high-quality spread sector alternatives, mainly increasing our asset backed sector weights. With the backup in rates over the quarter, we continued swapping shorter-duration Treasuries and Agency callables to extend our portfolio durations by purchasing Treasuries and various high- quality securities further out the curve. In our shorter Cash Plus strategies, we took the opportunity to add a pair of two-year maturity Federal Home Loan Mortgage Corporation (Freddie Mac) callables at attractive spreads of 90 and 100 basis points over matched-maturity Treasuries.
Outlook: As we start the second quarter, Fed officials have penciled in three fed-funds rate cuts for 2024. However, higher inflation readings at the start of the year have prompted caution among many policymakers. Ongoing strength in the economy coupled with sticky services sector inflation is leaning against the Fed cutting rates in the near term. Market expectations for the number of cuts are quickly fading from three to two cuts by the end of the year, in addition to the timing of the first rate cut also having been pushed out. We will closely monitor future inflation reports as it will be crucial to gauge the Fed’s tolerance for prolonged and sustained inflation above the 2% target, alongside developments in the labor market, which remains healthy. Volatility in the rates market should remain elevated as the market awaits inflation data while we will look to add duration on dips or when the market backs up. We will also be watching technical support levels for two-year Treasury rates at 4.85% and five-year Treasury rates around 4.50% to opportunistically look to shade duration slightly longer in our portfolios. As we expect the yield curve to steepen, we will continue to “bullet up” our yield curve posture in the coming months. TIPS breakeven rates continue to break out of their year-to-date ranges on the high side as inflation concerns persist. Looking ahead, we anticipate maintaining our positions. We believe GSE and SSA spreads will take their cues from risk sentiment but think further tightening should be muted. We also expect new issue supply to remain light in the near term and slow down substantially over the second quarter.
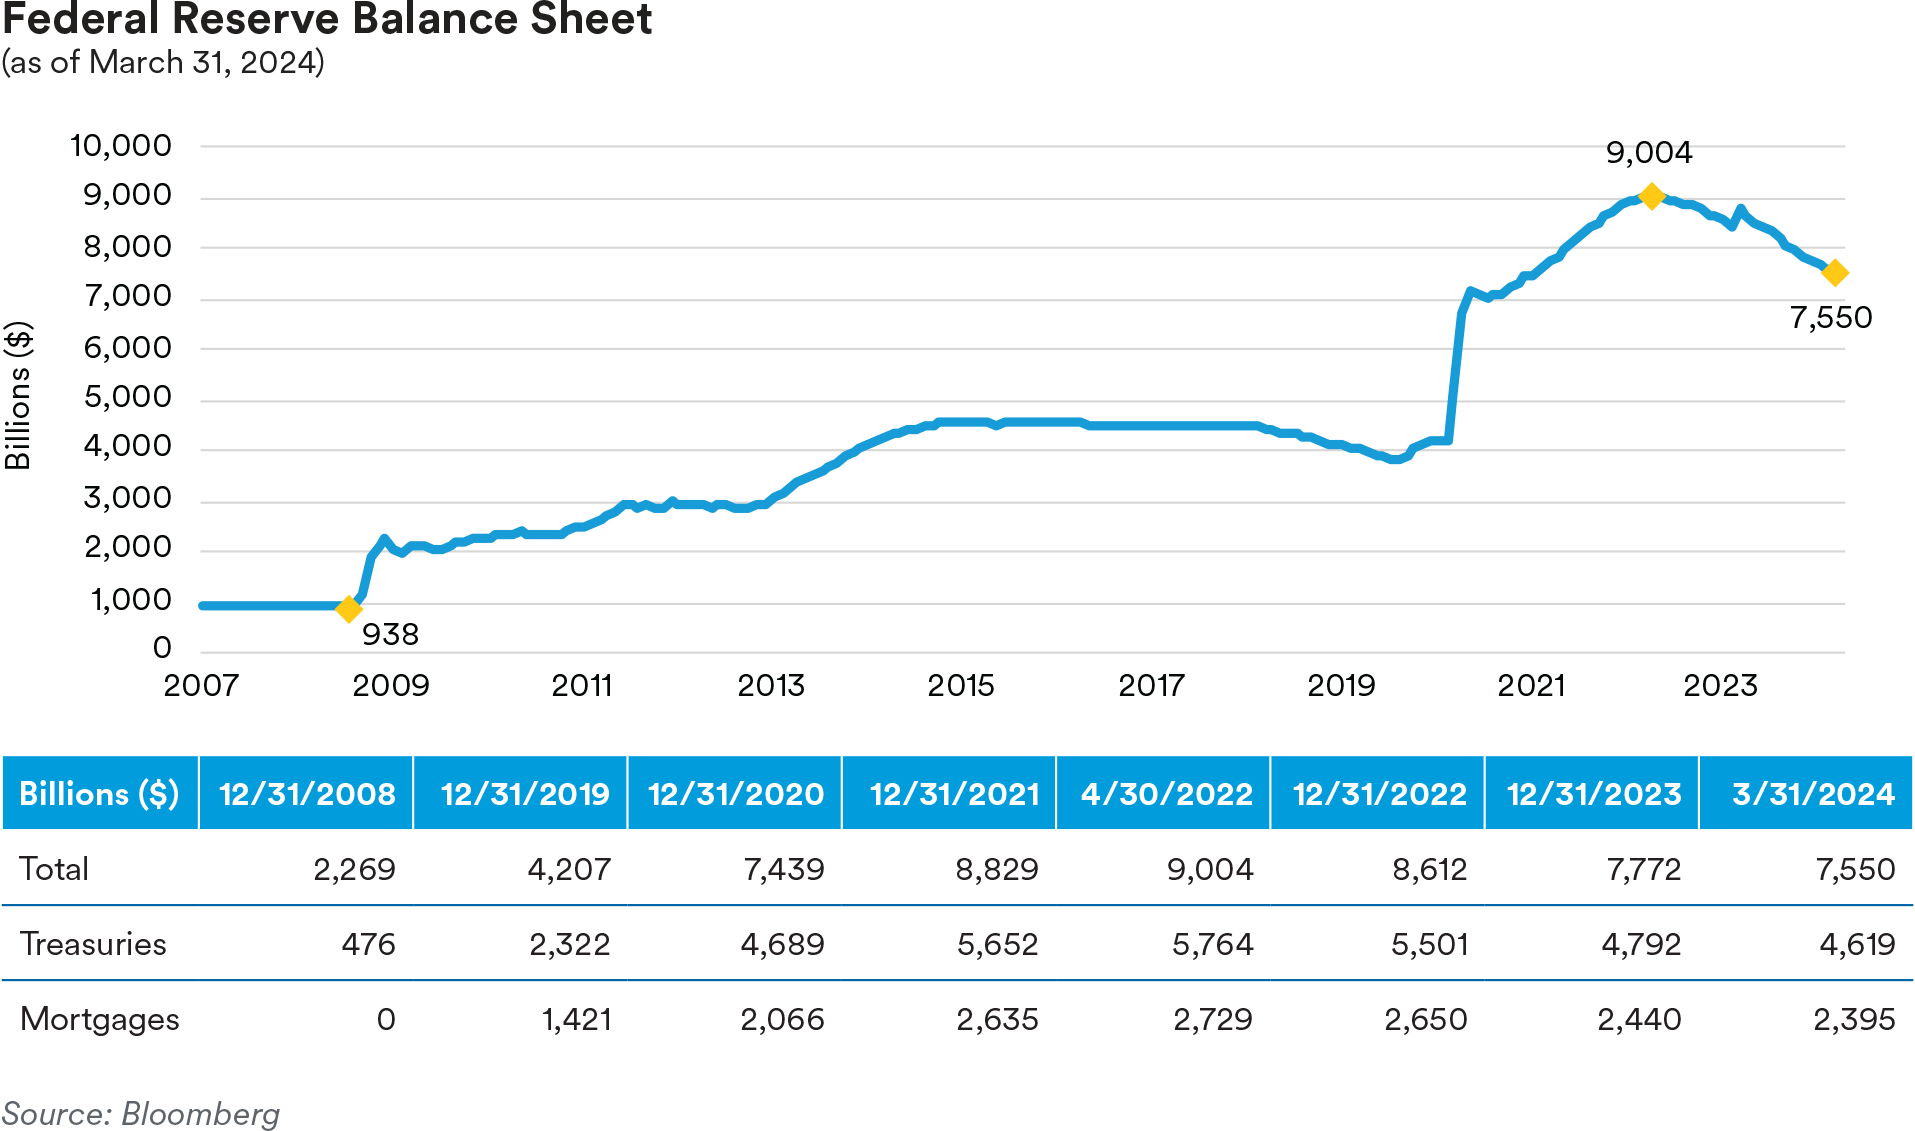
Discussions around the balance sheet and the Fed’s quantitative tightening program, specifically the roll-off of maturing assets, are ongoing. While policymakers weighed slowing the pace of QT at their March meeting, a concrete date has yet to be established. Given short-maturity Treasury bills are still yielding above the Fed’s overnight reverse repo program (RRP) rate of 5.30%, we expect the outflows will continue which are expected to bring RRP balances below $100 billion sometime in June. We think June would be the perfect time for the Fed to lean toward beginning its QT taper which will likely be announced at the May FOMC meeting. During Chair Powell’s press conference following the March meeting, he defined ample reserves as being a “bit less” than abundant. Ample includes a “cushion or buffer for reserves” such that the Fed “doesn’t...have to put reserves back into the system”. He also acknowledged that “right now we’d characterize reserves as abundant”. The Federal Reserve must strike a delicate balance between the risk of unintentionally identifying the minimum comfortable level of bank reserves and the risk of retaining an excessively large balance sheet by halting QT prematurely.
Performance: Our adjustments to our duration posture over the first quarter were a positive contributor to excess returns across all our strategies except for our Cash Plus strategy where duration was a modestly negative detractor from performance. Our curve positioning in the 1-3 and 1-5-year strategy portfolios produced positive excess returns while in our Cash Plus and Enhanced Cash strategies it was a detractor. The agency sector saw positive excess returns across all of our strategies which hold mainly agency callable securities.
ABS
Recap: Short-tenor ABS spreads tightened over the quarter as a relatively firm labor market and growing acceptance that the Fed might actually achieve a soft landing for the economy bolstered market sentiment. Benchmark three-year, AAA-rated credit card, prime auto and subprime auto tranches ended the quarter at spreads of 46, 57 and 77 basis points over Treasuries, 5, 6 and 16 basis points tighter, respectively. Three-year, floating-rate AAA-rate private student loan tranches ended the quarter at a spread of 105 basis points over SOFR, 21 basis points tighter. We attribute the outperformance of private student loan tranches to investor appetite for higher yielding short tranches with positive convexity dynamics. First quarter ABS issuance was robust with over $89 billion of new deals coming to market, a 50% increase compared to last year’s first quarter volume. In fact, January’s new issue supply (over $35 billion) was the highest for any single month since the Great Financial Crisis. As usual, the auto subsector dominated new issuance with almost $51 billion of new deals coming to the market during the quarter, 43% greater than the $36 billion seen last year. Following autos were the “other ABS” subsector (a “catch-all” category that includes deals collateralized by cell phone payment plans, timeshares, mortgage servicer advances, insurance premiums, aircraft leases, etc.) with almost $16 billion of new issuance and the equipment subsector with over $7 billion of new issuance. In comparison, in the first quarter last year, “other ABS” and equipment priced $14 billion and $5 billion of new deals, respectively. Notably, first quarter credit card new issuance surged to over $6 billion as banks returned to the market in seeking an alternative to deposit funding. Floorplan financing deal volume increased to almost $3 billion of new deals compared to only $400 million last year as auto inventory numbers rebounded from the semiconductor chip-induced shortages that hobbled new vehicle production in 2021 and 2022.

The industry held its annual “ABS West” conference in Las Vegas in late February. The conference saw record turnout with most participants expressing optimism about the outlook for ABS in the near term. Most attendees anticipated further deterioration in consumer asset backed credit metrics particularly for subprime borrowers but took comfort in 2023’s improved underwriting compared to the weaker 2022 vintage. The continued problems in commercial real estate, particularly for regional banks, was a noted area of worry.
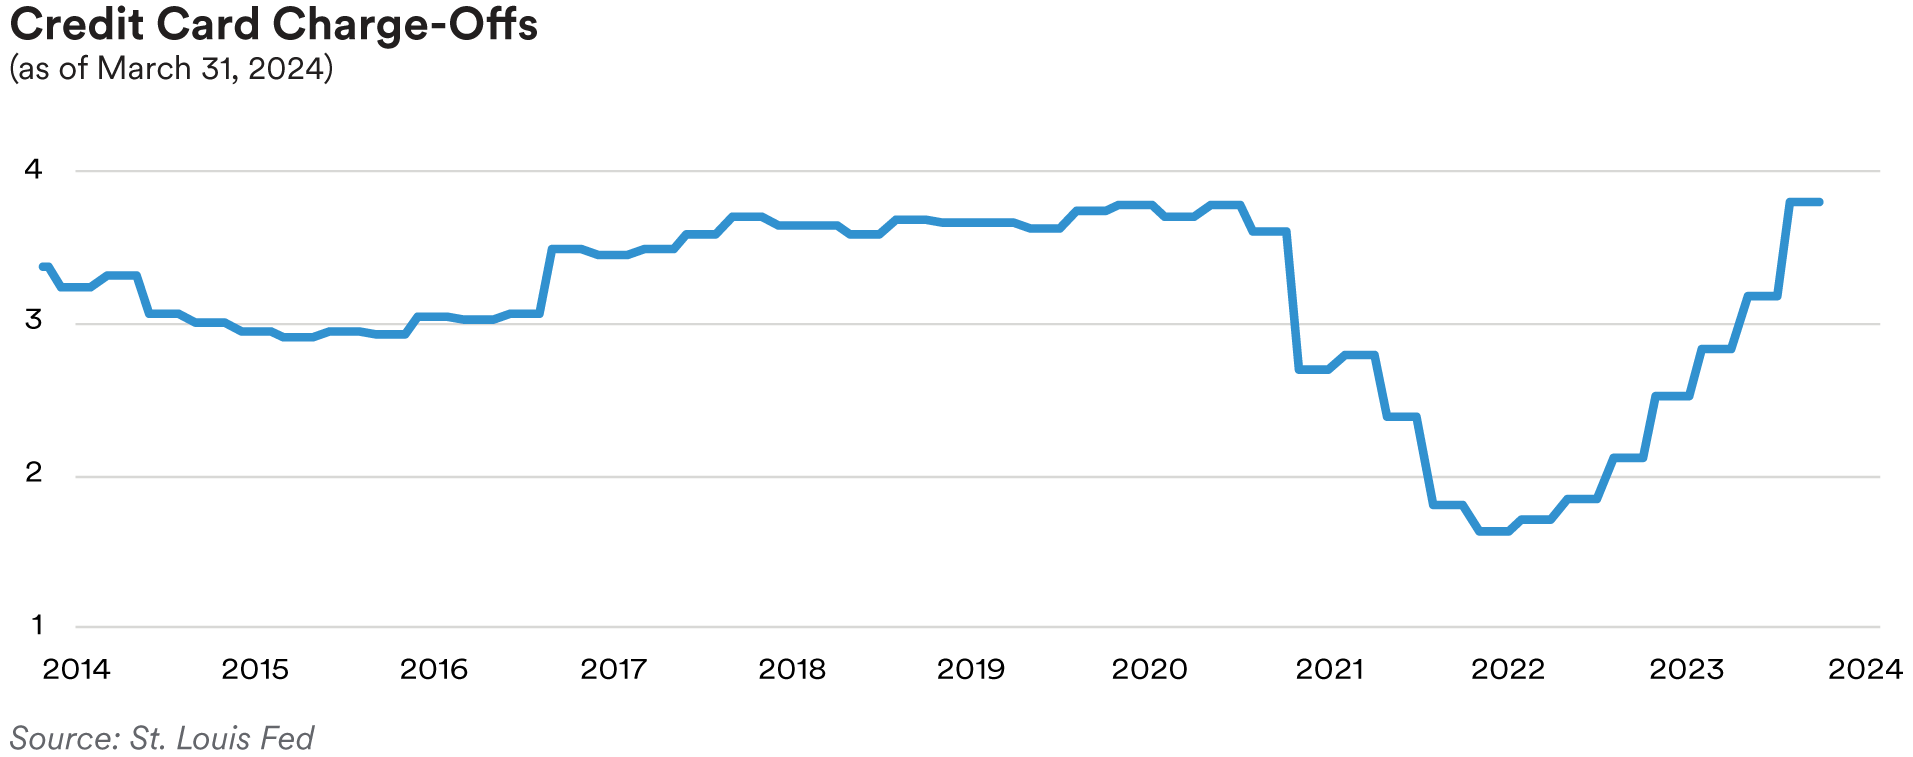
Following the trend we have seen over the last several quarters, credit card performance metrics continued to worsen over the first quarter. Data from the J.P. Morgan credit card performance indices reflecting the March remittance reporting period showed charge-offs and 60+-day delinquencies on bank credit card master trusts rising 23 basis points and 6 basis points, respectively, over the quarter, to 2.23% and 1.06%. Although charge-offs and delinquencies have been moving higher, they remain well below historic averages. In our opinion, further deterioration is likely as consumers grapple with a softening labor market, a shrinking pool of savings, higher interest rates and inflationary pressures. We believe ABS credit card trust performance will likely outperform their related bank managed credit card portfolios as they tend to have much more seasoning due to fewer new accounts being added to the trusts. For example, in comparison to the 2.23% charge-off rate seen in the most recent ABS trust reports, in February the St. Louis Fed reported that the charge-off rate for all commercial bank credit card portfolios was 4.07% at the end of 2023.
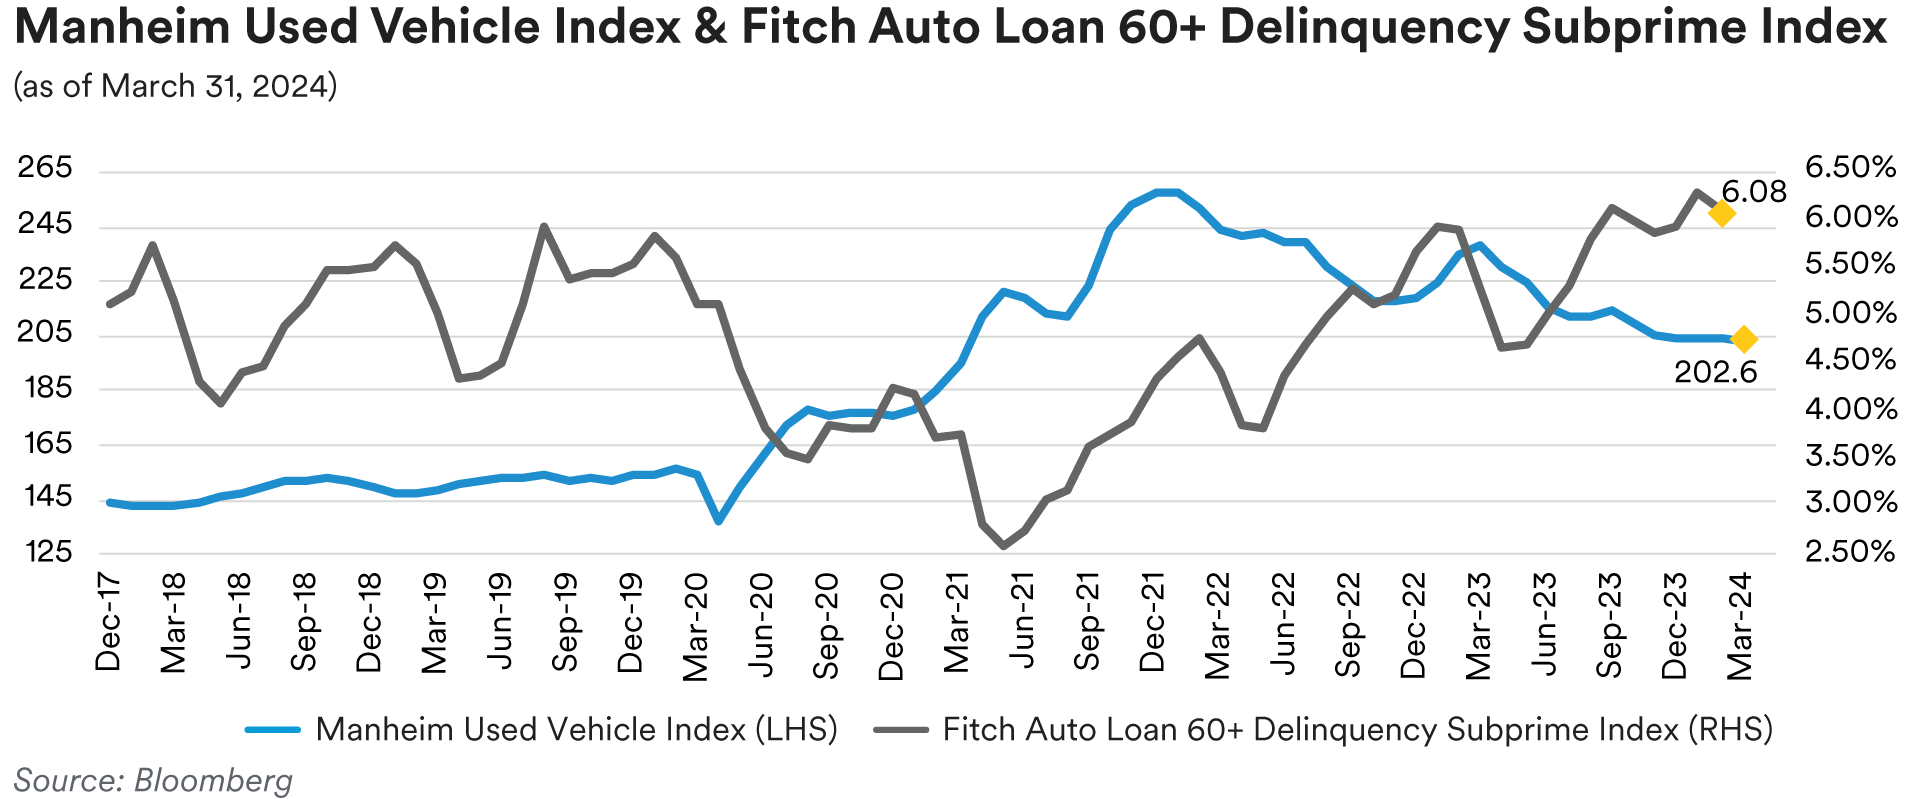
New vehicle sales numbers ended the quarter below market consensus expectations at a 15.5 million SAAR (seasonally-adjusted annualized rate) pace. Economists had been predicting a 15.9 million pace. The lackluster print fell around the midpoint of the range of sales volumes seen over the last year, with volumes bouncing around between 14.8 million and 15.9 million SAAR, healthy volumes but still below pre-pandemic levels which typically exceeded 16.0 million SAAR. As we have mentioned in prior commentaries, we believe higher interest rates and elevated new car prices have become the main constraints on sales numbers, in contrast to the computer chip-related inventory shortages seen two years ago. Used vehicle prices, as measured by the Manheim Used Vehicle Index, seem to have stabilized and remained rangebound over the quarter, after falling for most of last year. The index printed at 203.8 in February down just 0.1% relative to January’s 204.0 print but down over 13% from year-ago levels. Manheim noted that compared to year-ago prices, luxury cars lost less than the overall industry (down only 12%) while compact cars were the worst performers (down 16.5%). Manheim estimated that used car supply ended February at 46 days’ supply, down 8 days compared to January but 2 days higher than the 44 days’ supply seen at the end of February 2023.
Despite the stabilization in used car prices, rising interest rates and inflationary pressures continue to pressure auto ABS performance metrics. As of February’s data, the 60+-day delinquency rates on the Fitch Auto ABS indices were 0.38% for the prime index and 6.08% for the subprime index, 6 basis points and 18 basis points higher than year-ago levels, respectively. Similarly, annualized net loss rates for the indices stood at 0.54% for the prime index and 9.72% for the subprime index, reflecting year-over-year increases of 10 basis points and 106 basis points, respectively. As we have noted in previous commentaries, we believe the bifurcation between the prime and subprime indices reflects the fact that prime borrowers are better able to weather current economic strains than subprime borrowers. We expect this trend to continue though there may be some modest temporary improvement in the next few months as subprime borrowers receive tax refunds. Overall, despite our expectations for worsening credit performance, we remain quite comfortable with our holdings of AAA and AA-rated auto tranches as, in our opinion, these deals have more than ample credit enhancement to protect senior bondholders.
In other subprime auto news, on April 1 OneMain Holdings, a subprime consumer finance company, announced it had completed the acquisition of Foursight Capital (a subprime auto lender) that it had announced in November 2023 as part of OneMain’s expansion of its auto lending business. We believe further consolidation is likely for subprime auto originators as higher interest rates have made it harder for smaller players to compete against the scale advantages enjoyed by larger and better financed competitors.
The most recent Fed Senior Loan Officer Opinion Survey, reflecting sentiment as of the fourth quarter last year, showed banks reporting tighter lending standards for all consumer loan categories and generally weaker demand for auto, credit card and other consumer loans. The survey also contained a set of special questions regarding banks’ expectations for changes in lending standards, loan demand and expectations for loan performance for 2024. A significant share of banks reported expecting some deterioration in credit quality for credit cards and auto loans and increasing demand due to the expectation of lower interest rates.
Portfolio Actions: Maintaining our strategy from the last several quarters, we materially increased portfolio exposure to ABS across all of our strategies during the first quarter. As our economic outlook remains cautious, we continue to avoid more volatile sectors of the market and focus instead on defensive, liquid tranches. Accordingly, we still favor adding to our credit card and prime auto holdings rather than stretching for incremental yield in subprime auto and more esoteric subsectors. Similar to the last few quarters, we continued to purchase the front-pay “CP” tranches of various auto and equipment deals in our shorter strategies given these tranches stand at the top of the payment waterfall and carry short-term commercial paper ratings equivalent to AAA. Since they are structured to receive the first principal payments from the deal, they are the safest tranches in ABS deal structures from a credit perspective. In our longer strategy portfolios we remained focused on adding one-year and two-year AAA-rated senior tranches. We believe these securities have a favorable liquidity profile due to their very short average lives and continue to benefit from the inverted yield curve so often provide higher yields than longer tenor alternatives. Our purchases were made in both the primary new issue and secondary markets. For example, in the new issue market we purchased the 0.4-year, the 2.0-year and 3.8-year AAA-rated tranches of a fleet lease deal at spreads of 22, 90 and 110 basis points, respectively. In our view, the ‘business essential’ nature of fleet lease collateral makes it an attractive alternative to benchmark auto tranches, despite a modest liquidity concession. We continue to see prime auto securitizations from regional bank portfolios as regulatory capital changes make holding prime auto collateral less appealing for banks and credit unions seeking to diversify their funding bases. We participated in several of these deals. We also participated in the inaugural credit card transaction from a large money center bank, purchasing the AAA-rated three-year tranche at a spread of 57 basis points over Treasuries. While traditionally a portfolio asset for the bank, rising deposit rates motivated the issuer to diversify its funding sources via securitization of a portion of its credit card receivables. Also, as we noted in last quarter’s commentary, we find the incremental spread pickup of auto rental car securitizations attractive, and we participated in a new issue deal from one of these companies in our longer strategies. We purchased the 3.4-year and 5.6-year AAA-rated tranches at spreads of 90 and 115 basis points, respectively.

Outlook: With our expectation for the economy relatively unchanged, our outlook for ABS remains essentially the same. We still expect deteriorating ABS trust credit performance and maintain our bias towards more defensive tranches and subsectors. We still find ABS spreads attractive relative to other spread product but are mindful of the rising levels of ABS exposure across our portfolios. Accordingly, we are becoming even more selective and in many cases anticipate using sales of existing ABS holdings to fund new purchases rather than increasing ABS portfolio exposure outright. We still like short-tenor auto and equipment tranches but are moving towards a more neutral stance due to continued spread tightening in these subsectors. As noted above and in prior commentaries, we continue to prefer prime auto over subprime. However, we remain comfortable with a select group of subprime issuers who have a demonstrated history of successfully operating through credit cycles and who have business models and underwriting practices with which we are very familiar. We are unlikely to add to our CLO exposure as we believe leveraged loans will suffer heightened downgrades and defaults which might push CLO spreads wider.
Performance: After adjusting for their duration and yield curve positioning, our ABS holdings produced notable excess returns across all of our strategies in the first quarter. All subsectors were positive with our fixed-rate auto ABS holdings the top performers. Similar to the fourth quarter of last year, we think our fixed-rate fleet lease holdings also performed very well. Also, in our longest strategy, our fixed-rate equipment subordinate tranches posted notable positive excess returns. Finally, although positive for the quarter, our fixed-rate private student loan positions and credit card holdings were generally the weakest performers.
CMBS
Recap: Following the trend set in the fourth quarter of last year, short-tenor CMBS spreads continued to tighten over the first quarter despite continued negative headlines around commercial real estate generally and office properties in particular. At the end of the quarter, spreads on three-year AAA- rated conduit tranches stood at 86 basis points over Treasuries, 42 basis points tighter than at the start of the quarter. Spreads on five-year AAA-rated conduit tranches were 89 basis points over Treasuries, 51 basis points tighter. Three-year Freddie Mac “K-bond” agency CMBS tranches ended the quarter at a spread of 21 basis points over Treasuries, 7 basis points tighter. In our view, the tighter spreads reflect the impact of limited new issue supply in the sector. In particular, the relative outperformance of conduit tranches compared to K-bonds is likely the result of much lower supply in the non-agency conduit sector relative to agency CMBS. Three-year, AAA-rated, floating-rate single asset, single borrower (“SASB”) tranches ended the quarter at a spread of 125 basis points over SOFR, 23 basis points tighter. With higher interest rates and problems in the office subsector creating headwinds for origination, first-quarter new issue volume was relatively light with only $45 billion of new issue CMBS deals pricing. However, compared to $34 billion brought to market in last year’s first quarter, this quarter’s volume was 33% higher. One encouraging sign, in our view, is that this quarter’s non-agency volume ($19 billion) increased over 200% relative to last year’s first-quarter numbers ($6 billion). Agency volumes dropped about 6% relative to last year’s first quarter, coming in at $26 billion this year, compared to $28 billion in the first quarter of last year. 
With headwinds continuing to impact the commercial property markets, CMBS delinquencies continued to grind higher over the course of the quarter. As measured by the Trepp 30+-day delinquency rate, CMBS delinquencies ended the quarter at 4.67%, which reflected a slight drop of 4 basis points for the month of March compared to February’s level but an overall increase of 16 basis points for the quarter. Year-over-year, the overall delinquency rate has climbed 158 basis points. Trepp noted that the monthly dip in March delinquencies relative to February was due to continued improvement in the retail subsector which has seen four consecutive months of declines. Retail delinquencies ended the quarter at 5.56%, 91 basis points lower than at the start of the year. Office properties remain the worst-performing subsector with 6.58% delinquencies at quarter end. Ironically, this was actually a slight improvement from February’s level as office delinquencies improved 5 basis points on the month. However, for the quarter office delinquencies worsened by 76 basis points and are now 397 basis points higher than a year ago. Industrial properties remain the best-performing subsector with just 0.47% delinquent, 10 basis points lower over the quarter and only 10 basis points higher year-over-year. After rising 6 basis points in January to 5.46%, lodging property delinquencies were relatively stable over the quarter, printing at 5.45% in both February and March.
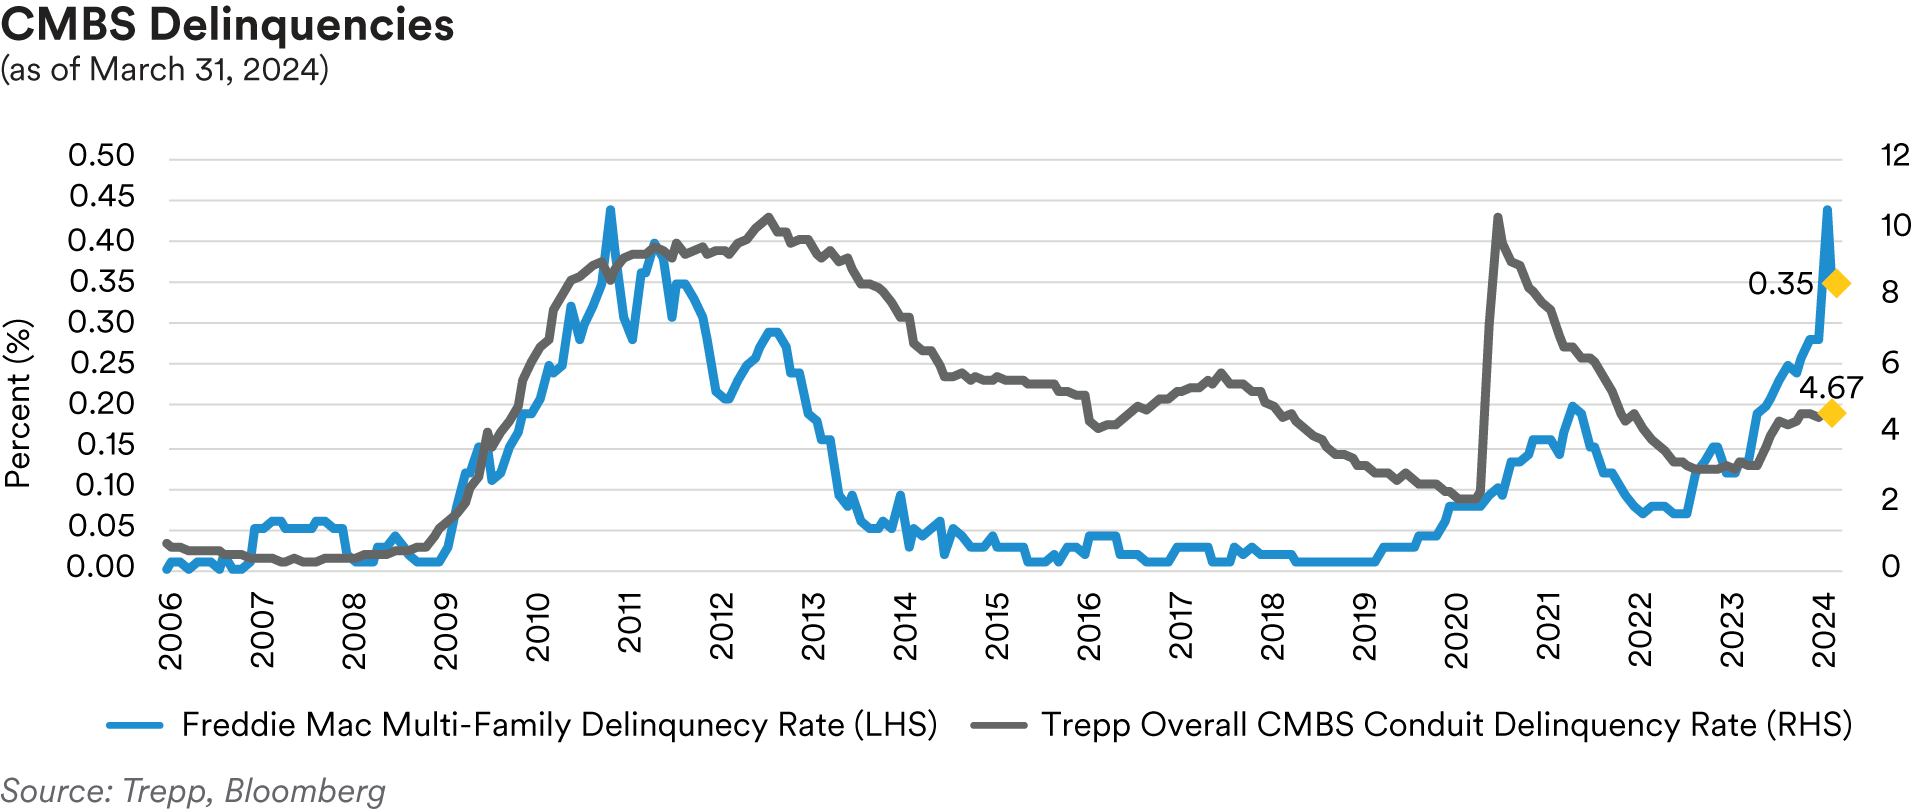
Year-over-year, lodging delinquencies stood 104 basis points higher.
Commercial property prices continued to fall over the course of the quarter as measured by the RCA CPPI National All-Property Composite Index. RCA’s data now shows prices have declined every month since July 2022 when the index peaked at 164.7. March’s report showed the index at 144.6 as of February, down 0.3% from January and a 4.0% annual drop. Weakness in the office sector continues to drive the price declines on the index with office prices now 15.2% lower year-over-year. Central business district (“CBD”) office properties have been the main vector of underperformance with prices down 30% year-over-year compared to suburban office properties which are down only 11.6%. Apartment prices are now down 8.9% from year ago levels but in one positive sign, the annual pace of decline for apartment prices has moderated for six consecutive months. Much like in prior quarters, industrial properties remain the best performers with prices up 1.9% annually, the only sector with positive year-over-year price changes. The Non-Major Metros continue to outperform the six Major Metros (Boston, Chicago, Los Angeles, New York, San Francisco and Washington, D.C.) with year-over-year prices down 3.6% and 5.6%, respectively.
However, RCA noted that the spread between the two has narrowed considerably from the middle of 2022 when there was more than a 10% difference between the two cohorts.
In one notable office property transaction, Consus Asset Management, a South Korean investment firm, agreed to purchase a Los Angeles office tower (777 S. Figueroa Street) for $145 million dollars in March from lenders which had taken possession of the property. The DTLA (“Down Town LA”) fund managed by Brookfield had previously owned the property but defaulted and walked away from the property’s $289 million of debt in February 2023. While selling a property at roughly 50% of the debt is very painful, we believe that visible market sale transactions rather than continual loan modifications and extensions are a necessary catalyst to restore health to the broader office property market.
The most recent Fed Senior Loan Officer Opinion Survey, reflecting sentiment as of the fourth quarter of last year, showed a significant share of banks tightening lending standards for all categories of commercial real estate (“CRE”) loans with smaller banks more widely reporting tightening than larger banks. Banks also reported lower CRE loan demand over the quarter. The survey also contained a set of special questions regarding banks’ expectations for changes in lending standards, loan demand and loan performance for 2024. Most respondents anticipate tightening lending standards for all types of CRE loans in 2024 and expect to see deteriorating credit performance. Historically, tightening standards for CRE loan loans precedes periods of rising delinquencies and charge-offs.
Portfolio Actions: We modestly reduced our CMBS exposure over the course of the quarter across all of our strategies. The reduction reflected the reinvestment of paydowns on our CMBS holdings into other spread sectors and the opportunistic sale of agency CMBS holdings from certain portfolios. As we have noted in previous commentaries, at current spreads we find agency CMBS relatively less attractive than some alternatives. In some instances, we have sold agency CMBS to fund purchases of other investments. Accordingly, the portfolios’ reduced CMBS exposure mostly reflects a proportionally lower quarter-end weighting to agency CMBS overall. Our purchase activity consisted of secondary market trades as we did not participate in any new issue deals during the quarter.
Outlook: We have not changed our CMBS subsector outlook. In confirmation of the expectations we mentioned in last quarter’s commentary, the tone at the CRE Finance Council (“CREFC”) conference held in early January in Miami was optimistic with most investors less bearish due to December’s interest rate retracement to modestly lower levels and the possibility that the Fed might actually achieve a soft landing for the economy. Despite the better sentiment, we still remain very cautious around CMBS as we expect to see more deterioration in trust credit metrics and additional declines in commercial property prices, particularly for office properties. We continue to monitor the multifamily sector as rising delinquencies are likely to impact the agency market and have broad implications for regional banks and the overall economy. With this backdrop, we are predisposed to avoid most SASB securitizations and conduit tranches with heavy office property exposures. We remain biased to gradually lower our exposure to agency CMBS since, as mentioned above, spreads have tightened in that sector such that better alternatives are available elsewhere. We expect to continue using the sale of agency CMBS as a funding source for purchases in other spread sectors including possibly the single-family rental (“SFR”) subsector in RMBS. With spreads moving tighter recently, seasoned conduit “ASB” CMBS tranches, which have more stable average life profiles compared to other conduit CMBS tranches, are somewhat less attractive so our purchases in that area are likely to slow.
Performance: Our CMBS holdings generated positive excess returns for the quarter across all of our strategies after adjusting for their duration and yield curve posture. In our shorter Cash Plus and Enhanced Cash strategies our non-agency holding were the best performers while in our 1-3 year and 1-5 year strategies our agency holdings came out on top. The reason for this divergence in performance stemmed from the strong excess returns generated by our floating- rate SASB holdings which are concentrated in our shorter strategies. Within agencies, our Freddie Mac “K-bond” positions generally outperformed our Fannie Mae DUS holdings, although both subsectors were positive contributors to performance in the aggregate.
RMBS
Recap: Residential mortgage-backed securities generated negative performance over the first quarter as spreads remained rangebound. The Bloomberg mortgage index posted 14 basis points of negative excess return for the quarter as positive performance in March (+34 basis points) was insufficient to compensate for weakness in January (-19 basis points) and February (-29 basis points). Overall, generic 30-year collateral ended the quarter at a spread of 140 basis points over ten-year Treasuries (3 basis points wider) while 15-year collateral ended the quarter at a spread of 75 basis points over five-year Treasuries (2 basis points tighter). Much like in the fourth quarter of last year, we attribute the slightly better performance of shorter collateral to a continued rebound from relative weakness seen last year (at the end of last September 15-year mortgages had widened 53 basis points from the start of 2023, compared to only 24 basis points of widening for 30-year mortgages). Non-agency spreads remained relatively stable with prime front cashflow tranches ending the quarter at 170 basis points over Treasuries, the same level seen at the start of the year.
In ESG news, in January Fannie and Freddie announced revisions to their ‘social scores’ and renamed them “Mission Index Scores”. These will serve as the framework for future social bond agency MBS issuance. In comparison to the prior social score iteration, mission scores add three characteristics (affordable rental, underserved markets and special purpose credits) and remove minority borrower characteristics. The Single Family Social Bond Framework received a second- party opinion from Sustainalytics as “robust, transparent, and in alignment with the four core components of the Social Bond Principles 2023”.
March’s prepayment data showed paydowns on the Fed’s mortgage portfolio came in at $14.8 billion in February, modestly higher than the $14.6 billion seen in January. With paydowns well below the $35 billion reinvestment cap, we expect the Fed to continue to allow its MBS holdings to run off. Notably, following the March FMOC meeting, Chair Powell said that the Fed is nearing a decision on slowing the pace of balance sheet runoff. As we mentioned in last quarter’s commentary, in our view the likely outcome is for the Fed to reduce the pace of balance sheet reduction by reinvesting its Treasury maturities and MBS paydowns into Treasuries, which also serves to move the Fed towards its preferred outcome of an all-Treasury balance sheet.
Mortgage rates rose over the quarter with the Freddie Mac Primary Mortgage Market Survey ending March at 6.79%, 18 basis points higher than the start of the year. As a consequence of higher rates, most mortgages are still outside of the refinancing window with the average rate on outstanding mortgages at 3.80%. Against this background, mortgage prepayments remain at low to mid-single digit CPRs. March’s prepayment report showed 30-year Fannie Mae mortgages paying at 4.6 CPR in February, 10% faster than the 4.2 CPR seen in January. 15-year prepayments were flat at 5.4 CPR. Despite the approach of the spring selling season, with five and ten-year yields both more than 30 basis points higher than at the start of the year, we expect prepayments to remain relatively stable over the next few months. The Case-Shiller National Home Price Index fell for the fourth month in a row with the March release showing prices falling at a 2.92% annualized rate for the three-month period ending in January. Despite the recent drop, prices still rose 6.03% year- over-year, the fastest annual pace seen since 2022. March’s release saw all 20 cities tracked by Case-Shiller post a second consecutive month of annual price gains, with notable strength seen in San Diego (+11.2%), Los Angeles (+8.6%) and Detroit (+8.2%). Dallas (+2.9%), Denver (+2.7%) and Portland (+0.9%) closed the quarter with the slowest annual growth. We maintain our outlook that despite higher mortgage rates, we are likely to see continued low to mid-single digit annualized growth rates in housing prices going forward as limited inventory should continue to support home prices for the foreseeable future.
After bottoming out in the fourth quarter last year, existing home sales rebounded over the quarter with March’s release showing sales surging 9.5% in February to a 4.38 million annualized pace, after rising 3.1% in January. February’s increase was the fastest pace in a year and exceeded economists’ projections of a 1.3% decline in existing home sales numbers. We believe the strong sales volume might reflect the fact that homeowners are finally accepting that higher mortgage rates are here to stay and that they can no longer delay moving. There was a notable increase in the number of homes listed for sale, which pushed inventory to 1.07 million homes, the highest level for any February since 2020. However, despite the rise in inventory, at the current sales pace selling all the properties on the market would still take only 2.9 months. Realtors see anything below five months of supply as indicative of a tight market. New home sales fell to a 662,000 annualized rate in February, compared to a 664,000 in January. The drop was unexpected as economists had projected an increase to a 677,000 annualized pace and was led by declines in the Northeast and Midwest which offset rising sales in the South and West. While more volatile, new home sales numbers are seen as a more real-time measurement of market sentiment than existing home sales numbers as the sales data is calculated from when contracts are signed rather than when they close, which is the case for sales of existing homes. Home builder sentiment improved over the quarter with the National Association of Home Builders Market Index rising in March to 51, the fourth consecutive monthly increase and the highest level seen since last July (a number above 50 indicates that more builders view market conditions as “good” rather than “poor”). Commenting on the numbers, the NAHB noted that while demand was strong and consumers were moving off the sidelines and into the market, builders continue to face challenges from a scarcity of both buildable lots and skilled labor.
The January release of the Senior Loan Officer Survey, reflecting sentiment as of the fourth quarter of 2023, showed banks tightened lending standards for most residential real estate loans other than agency-guaranteed eligible loans, which saw lending standards generally unchanged. Banks also reported generally weaker demand for all types of residential real estate loans. As part of a set of special questions in the survey, banks were asked about their expectations for changes in lending standards, borrower demand and asset quality over the coming year assuming that the economy performs in line with consensus expectations. Most banks reported that they expect residential real estate lending standards to remain unchanged, loan demand to increase due to expected declines in interest rates and asset quality to deteriorate.
Portfolio Actions: Over the course of the first quarter, we slightly increased our RMBS exposure across all of our strategies. The increase predominantly reflected secondary market purchases of 15-year specified pools and various non-agency tranches as our agency CMO exposure slightly declined. In non-agencies our purchases were focused on short-tenor NPL/RPL and SFR tranches. In addition, we participated in one new issue deal early in the quarter: for our longer portfolios, we purchased the five-year AAA-rated tranche of a SFR securitization at a spread of 120 basis points over Treasuries.
Outlook: While we are biased to increase our RMBS exposure, we remain cautious given current spreads and the likely outlook for the economy. We expect to add opportunistically to our short- tenor non-agency holdings but are still avoiding Non-QM tranches and focusing instead on the NPL/RPL subsector where prepayment speeds are less determinative of overall returns. As we noted in last quarter’s commentary, we find SFR tranches attractive and are likely to add further exposure across most of our strategies. As always, we remain mindful of the inferior liquidity profile of non-agency tranches relative to specified pools and require commensurate spread concessions. We still find seasoned 20-year pools (which are deliverable into the 30-year TBA market) offering attractive relative value compared to 15-year specified pools and continue to evaluate both outright purchases and potential swaps out of some of our 15-year holdings into seasoned 20-year pools.
Performance: Our RMBS positions contributed positive excess performance to the portfolios over the quarter after adjusting for their duration and yield curve posture. Our non-agency holdings were the top performers with notable strength in both our NPL/RPL and SFR positions. Our Enhanced Cash strategy also saw notable outperformance from our floating-rate prime non-agency subordinate positions which saw spread tightening reflective of the benign outlook for residential mortgage credit going forward. Our specified pool positions were generally flat over the quarter, a performance that topped the lackluster excess return of the broader MBS index as noted above.
Municipal
Recap: According to Bank of America, total municipal new issue supply was $101 billion in the first quarter and as a component of total supply, taxable municipal issuance was $5.5 billion, 61% lower on a year-over-year basis. Muted new issue supply coupled with tighter credit spreads in the front part of the municipal market curve resulted in positive excess returns for the sector. For the quarter, the ICE BofA 1-5 Year U.S. Taxable Municipal Securities Index had a total return of 0.43%, with OAS narrowing 17 basis points to end the quarter at 31 basis points, compared to the ICE BofA 1-5 Year U.S. Treasury Index’s total return of -0.02%.
Credit fundamentals, as demonstrated by S&P’s upgrade-to-downgrade ratio of 2.2 to 1 over the first two months of the year, have continued to be resilient. During the quarter, there were quite a few noteworthy rating upgrades across different sectors. The State of Louisiana was upgraded to AA from AA- by S&P. The rating agency’s rationale for the upgrade was the State’s focus on improving and maintaining its reserve levels as well as efforts to reduce unfunded pension liabilities. Moody’s upgraded CommonSpirit Health to A3 from Baa1 citing margin improvement, market position, diversified geographic and care delivery options, and expected continuation of operating improvement as further implementation of integration goals are achieved. Fitch upgraded the State of Hawaii Airport System to AA- from A+ reflecting the System’s full recovery in enplanements, along with completion of major projects throughout airports under its purview. The rating agency also upgraded the System’s outstanding customer facility charge revenue bonds to A+ from A. This upgrade was mainly due to the improved demand for rental cars, which was a result of the recovery in passenger traffic.
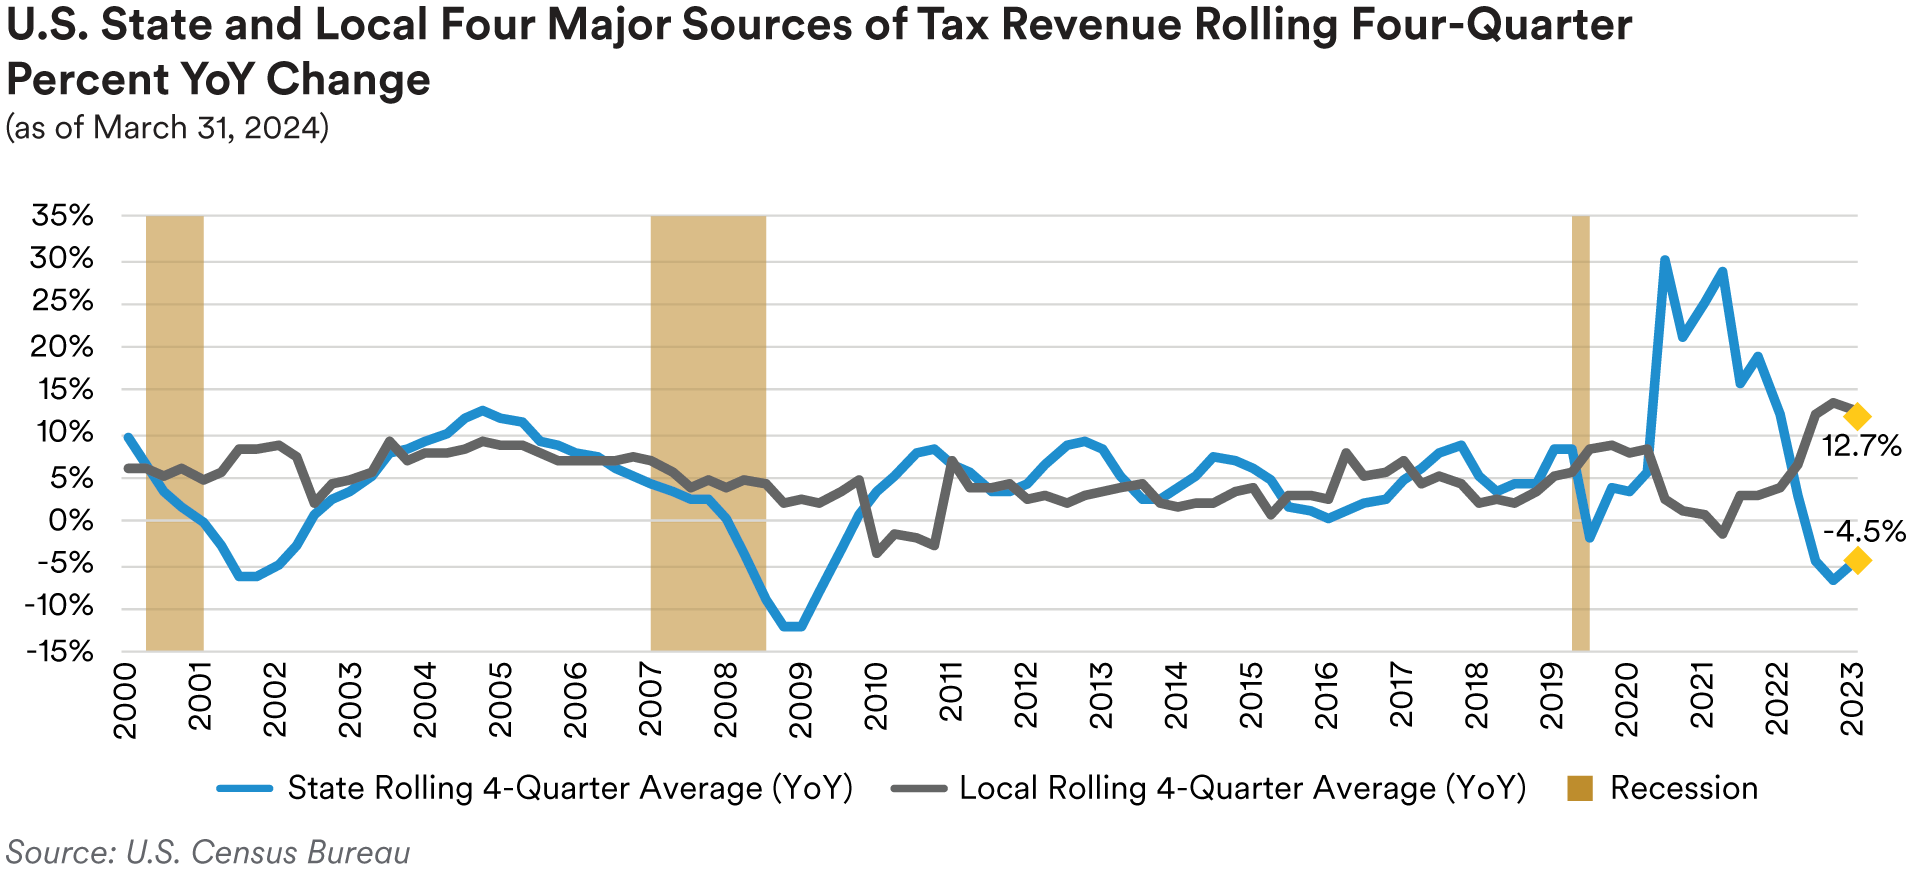
Overall, based on U.S. Census Bureau data collected for state and local tax revenues through December 31, 2023, state receipts reversed their negative trajectory while receipts at the local level started to turn negative from the four major tax sources (personal income, corporate income, sales and property taxes). The graph below highlights an improvement in revenue receipts at the state level and a modest decrease in revenues at the local level when comparing year-over-year percentage change in revenues from these major sources on a trailing four-quarter average basis. The Urban Institute attributed the rebound in state tax revenue collections to strong collections in California, where revenues were temporarily boosted during the fourth quarter. This is because most California taxpayers were offered extensions for storm relief, resulting in an extension or postponement of income tax payments to November 16, 2023.
We continue to monitor pension funding levels that can impact state budgets with lower levels having the potential to stress balance sheets. One indicator we monitor is Milliman’s Public Pension Funding Index, which is comprised of the 100 largest U.S. public pension plans. This index fluctuated during the first two months of the quarter, ending slightly higher than levels reported for year-end 2023. The index increased to 78.2% at the end of December from 75.9% in November, and then declined to 77.7% at the end of January. The index rebounded in February to an estimated 78.6%, the highest level since April 2022 (also 78.6%), due to overall positive asset performance. The index remains well below its 85.5% peak, however, reached at year-end 2021.
Portfolio Actions: Our allocation to taxable municipals was maintained across our strategies over the first quarter. On the new issue front, we added to exposure in the state obligation sector. In the secondary market, we were active in adding to high-quality issuers in the airport, healthcare, highway, and state and local obligation sectors. We continued to utilize the taxable municipal market to provide liquidity and raise funds in our portfolios, allowing us to invest in better relative value opportunities in other sectors or high-quality municipal issues positioned further out the maturity spectrum. To that end we sold shorter-duration bonds, predominately those with maturities within one year, where we felt there was limited potential for further spread compression.
Outlook: In our previous commentary, we noted that while municipal credit fundamentals have recently proven their resiliency with issuer balance sheets and reserves healthy overall, we feel we may have reached a peak in municipal credit conditions. Many of the pandemic-related aid programs totaling approximately $800 billion have come to an end, according to The Pew Charitable Trusts. This means that many state policymakers will face tough decisions as they manage state budgets. Most states have seen record surpluses, largely due to the federal aid combined with higher-than-expected growth in tax revenue. This has allowed states to carry out tax cuts and increase spending between 2021 and 2023, while also enabling them to decrease their need to issue debt in a higher interest rate environment. After two years of tax revenue growth, states have lowered their expectations for fiscal-year 2024. State lawmakers will need to balance the effects of increased costs and/or tax cuts. However, it is expected that most states will rely on a mix of rainy-day savings, revenue-raising measures, and spending cuts to manage their budgets. Based on data from the National Association of State Budget Officers, the below graph shows a projected decline in both rainy-day and general fund balances during 2024. Keeping potential budget stress in mind, we favor state and local governments that have financial flexibility, diverse economies, and increasing populations. However, we will exercise caution when it comes to states that have decreasing revenues and tax systems that are vulnerable to economic slowdowns, especially when they have significant pension liabilities or other high fixed costs.

In revenue bonds, one of the sectors we continue to favor is airports. U.S. air travel has exceeded pre-pandemic levels, with 2023 TSA throughput coming in at 102% of 2019 levels. In the first quarter, TSA throughput was 107% of comparable 2019 levels. As has been the case for the past four years, enplanement recovery has not been consistent across all airports with preferred hub and warm- weather, leisure destinations having the most pronounced traffic growth with traffic at coastal airports relying on international travelers lagging the U.S. average. At this point, throughput at West Coast airports, which have historically relied in part on Asian travelers, has not fully recovered to pre-pandemic levels, reaching only approximately 90% of 2019 levels. Many airport forecasts made during the early stages of the pandemic projected full recovery of passenger traffic by 2025, so enplanement growth is generally progressing according to their plans. In any case, U.S. airports function as “pass-through” entities in terms of their finances and pledge to levy fees and charges sufficient to cover expenses, including debt service. We recently had the opportunity to meet with management teams from several airports at an investor forum. One of the key takeaways was that business travel has undergone some structural changes, resulting in fewer business-related flights. This is more of a negative for airlines than it is airports, although even the airlines will adjust their prices accordingly. Management is going full speed ahead on their capital improvement projects, which include gate expansions, terminal renovations, parking additions, runway expansions/additions, and overall modernization efforts. Many of these projects are overdue and are needed for airports to handle additional traffic demand as well as facilitate the larger airplanes scheduled to be brought into service over the next several years. Most remaining federal funds/grants from the pandemic (e.g. CARES Act monies) will be spent in 2024, and airports have maintained their reserves, which puts them in a good place in terms of financial stability as they build out and renovate their assets. We see opportunity in the airport sector as issuers raise money in the capital markets to fund their capital plans. While the bulk of this issuance will likely be in the tax-exempt market, projects such as rental car facilities, for-profit parking structures, and certain retail space expenses will need to be financed with taxable bonds. We favor airports located in desirable, high-growth areas and those located on the coasts which stand to benefit from a fuller recovery in international travel. The pandemic and recovery ushered in changes in consumer travel and airline hub preferences, and we are more cautious regarding airports that have lost hub traffic.
We maintain a defensive bias in the municipal sector and are carefully evaluating purchases for our strategies. We are focused on issuers that not only demonstrate strong credit fundamentals but also on bonds that provide a relative value opportunity for our portfolios. Although we have a positive outlook on the credit fundamentals in the municipal sector, we are aware that the current macroeconomic environment may put pressure on budgets. As a result, we are prioritizing issuers that have financial and operational flexibility and have demonstrated their management ability and willingness to make necessary budgetary decisions/adjustments. In an investment environment characterized by macro market volatility and economic uncertainty, we view taxable municipals as a defensive alternative to other spread sectors and will increase our allocation to the sector as opportunities arise.
Performance: Our taxable municipal holdings generated positive performance across our strategies in the first quarter. On an excess return basis, some of our best performing sectors included Airports, Highways, and State and Local Tax-backed issues.
Disclaimer
This material is intended solely for Institutional Investors, Qualified Investors and Professional Investors. This analysis is not intended for distribution with Retail Investors.
This document has been prepared by MetLife Investment Management (“MIM”)1 solely for informational purposes and does not constitute a recommendation regarding any investments or the provision of any investment advice, or constitute or form part of any advertisement of, offer for sale or subscription of, solicitation or invitation of any offer or recommendation to purchase or subscribe for any securities or investment advisory services. The views expressed herein are solely those of MIM and do not necessarily reflect, nor are they necessarily consistent with, the views held by, or the forecasts utilized by, the entities within the MetLife enterprise that provide insurance products, annuities and employee benefit programs. The information and opinions presented or contained in this document are provided as of the date it was written. It should be understood that subsequent developments may materially affect the information contained in this document, which none of MIM, its affiliates, advisors or representatives are under an obligation to update, revise or affirm. It is not MIM’s intention to provide, and you may not rely on this document as providing, a recommendation with respect to any particular investment strategy or investment. Affiliates of MIM may perform services for, solicit business from, hold long or short positions in, or otherwise be interested in the investments (including derivatives) of any company mentioned herein. This document may contain forward-looking statements, as well as predictions, projections and forecasts of the economy or economic trends of the markets, which are not necessarily indicative of the future. Any or all forward-looking statements, as well as those included in any other material discussed at the presentation, may turn out to be wrong.
All investments involve risks including the potential for loss of principle and past performance does not guarantee similar future results. Property is a specialist sector that may be less liquid and produce more volatile performance than an investment in other investment sectors. The value of capital and income will fluctuate as property values and rental income rise and fall. The valuation of property is generally a matter of the valuers’ opinion rather than fact. The amount raised when a property is sold may be less than the valuation. Furthermore, certain investments in mortgages, real estate or non-publicly traded securities and private debt instruments have a limited number of potential purchasers and sellers. This factor may have the effect of limiting the availability of these investments for purchase and may also limit the ability to sell such investments at their fair market value in response to changes in the economy or the financial markets.
In the U.S. this document is communicated by MetLife Investment Management, LLC (MIM, LLC), a U.S. Securities Exchange Commission registered investment adviser. MIM, LLC is a subsidiary of MetLife, Inc. and part of MetLife Investment Management. Registration with the SEC does not imply a certain level of skill or that the SEC has endorsed the investment advisor.
This document is being distributed by MetLife Investment Management Limited (“MIML”), authorised and regulated by the UK Financial Conduct Authority (FCA reference number 623761), registered address 1 Angel Lane, 8th Floor, London, EC4R 3AB, United Kingdom. This document is approved by MIML as a financial promotion for distribution in the UK. This document is only intended for, and may only be distributed to, investors in the UK and EEA who qualify as a “professional client” as defined under the Markets in Financial Instruments Directive (2014/65/EU), as implemented in the relevant EEA jurisdiction, and the retained EU law version of the same in the UK.
For investors in the Middle East: This document is directed at and intended for institutional investors (as such term is defined in the various jurisdictions) only. The recipient of this document acknowledges that (1) no regulator or governmental authority in the Gulf Cooperation Council (“GCC”) or the Middle East has reviewed or approved this document or the substance contained within it, (2) this document is not for general circulation in the GCC or the Middle East and is provided on a confidential basis to the addressee only, (3) MetLife Investment Management is not licensed or regulated by any regulatory or governmental authority in the Middle East or the GCC, and (4) this document does not constitute or form part of any investment advice or solicitation of investment products in the GCC or Middle East or in any jurisdiction in which the provision of investment advice or any solicitation would be unlawful under the securities laws of such jurisdiction (and this document is therefore not construed as such).
For investors in Japan: This document is being distributed by MetLife Asset Management Corp. (Japan) (“MAM”), 1-3 Kioicho, Chiyoda-ku, Tokyo 102-0094, Tokyo Garden Terrace KioiCho Kioi Tower 25F, a registered Financial Instruments Business Operator (“FIBO”) under the registration entry Director General of the Kanto Local Finance Bureau (FIBO) No. 2414, a regular member of the Japan Investment Advisers Association and the Type II Financial Instruments Firms Association of Japan. As fees to be borne by investors vary depending upon circumstances such as products, services, investment period and market conditions, the total amount nor the calculation methods cannot be disclosed in advance. All investments involve risks including the potential for loss of principle and past performance does not guarantee similar future results. Investors should obtain and read the prospectus and/or document set forth in Article 37-3 of Financial Instruments and Exchange Act carefully before making the investments.
For Investors in Hong Kong S.A.R.: This document is being issued by MetLife Investments Asia Limited (“MIAL”), a part of MIM, and it has not been reviewed by the Securities and Futures Commission of Hong Kong (“SFC”). MIAL is licensed by the Securities and Futures Commission for Type 1 (dealing in securities), Type 4 (advising on securities) and Type 9 (asset management) regulated activities. For investors in Australia: This information is distributed by MIM LLC and is intended for “wholesale clients” as defined in section 761G of the Corporations Act 2001 (Cth) (the Act). MIM LLC exempt from the requirement to hold an Australian financial services license under the Act in respect of the financial services it provides to Australian clients. MIM LLC is regulated by the SEC under US law, which is different from Australian law.
MIMEL: For investors in the EEA, this document is being distributed by MetLife Investment Management Europe Limited (“MIMEL”), authorised and regulated by the Central Bank of Ireland (registered number: C451684), registered address 20 on Hatch, Lower Hatch Street, Dublin 2, Ireland. This document is approved by MIMEL as marketing communications for the purposes of the EU Directive 2014/65/EU on markets in financial instruments (“MiFID II”). Where MIMEL does not have an applicable cross-border licence, this document is only intended for, and may only be distributed on request to, investors in the EEA who qualify as a “professional client” as defined under MiFID II, as implemented in the relevant EEA jurisdiction. The investment strategies described herein are directly managed by delegate investment manager affiliates of MIMEL. Unless otherwise stated, none of the authors of this article, interviewees or referenced individuals are directly contracted with MIMEL or are regulated in Ireland. Unless otherwise stated, any industry awards referenced herein relate to the awards of affiliates of MIMEL and not to awards of MIMEL.
1 As of December 31, 2023, subsidiaries of MetLife, Inc. that provide investment management services to MetLife’s general account, separate accounts and/or unaffiliated/third party investors include Metropolitan Life Insurance Company, MetLife Investment Management, LLC, MetLife Investment Management Limited, MetLife Investments Limited, MetLife Investments Asia Limited, MetLife Latin America Asesorias e Inversiones Limitada, MetLife Asset Management Corp. (Japan), MIM I LLC, MetLife Investment Management Europe Limited and Affirmative Investment Management Partners Limited.


