Moving Toward Normalcy
The post-COVID years have been characterized by dramatic shifts in economic conditions, capital markets and the geopolitical landscape. No two years have been quite the same, and uncertainty in the outlook for the economy in general, and commercial real estate in particular, has been historically elevated (Exhibit 1).
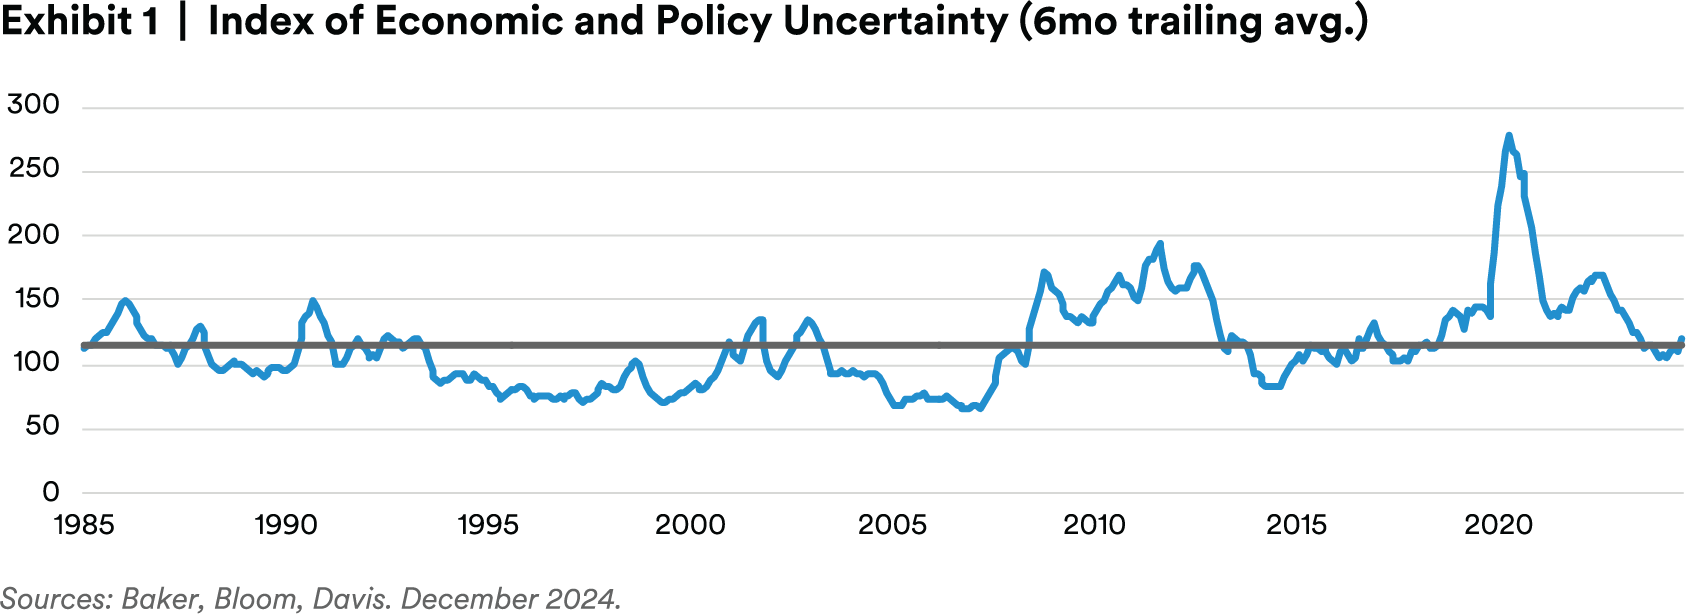
For real estate investors, this level of uncertainty brought with it challenges for projecting performance and underwriting new investments. It has also contributed to the wide bid-ask spread in the market today, and the cyclically low level of transaction activity (Exhibit 2).

However, as we look forward to 2025, economic uncertainty has significantly improved.
Key economic indicators appear to be heading in the right direction: inflation toward the Fed’s target; labor market growth settling into a range that is neither too hot nor too cold; and a healthy consumer. Changes in the outlook for Fed policy have become less volatile with each FOMC meeting (though some questions remain on the path of rate cuts). Even as we enter a year with a new Congress and presidential administration, the outlook is clearer than it has been in recent years. We expect a healthy level of 2.3% GDP growth in 2025 and expect the 10-year Treasury rate to end the year in the low 4% range. In other words, 2025 could look a lot like 2024.
Are there downside risks that could derail this optimism? For real estate investors, two key issues to closely monitor this year include the magnitude and impacts of potential new immigration policies, and movements in inflation expectations (and thus interest rates).
Immigration policy is complex on multiple levels, but policies that lead to slowing or negative population growth can be inflationary, harm business and consumer confidence, and negatively impact residential demand. Other policy proposals from the new administration like the extension of the Tax Cuts and Jobs Act and trade restrictions could potentially lift inflation expectations and put upward pressure on long-term interest rates. A 10-year Treasury above 5.0% for more than a quarter would cause us to revisit our views.
Cycle Indicators
Declining economic uncertainty is coinciding with another market phenomenon: an inflection point in the real estate cycle. In last year’s outlook, Lifting Fog, we mentioned that spot prices (outside office) were likely at or past a trough.
We have even stronger conviction in that view today and have reason to believe the positive value growth we have been observing for the last few quarters will persist into 2025. This has strategy implications for investors considering entry points as the real estate cycle turns.
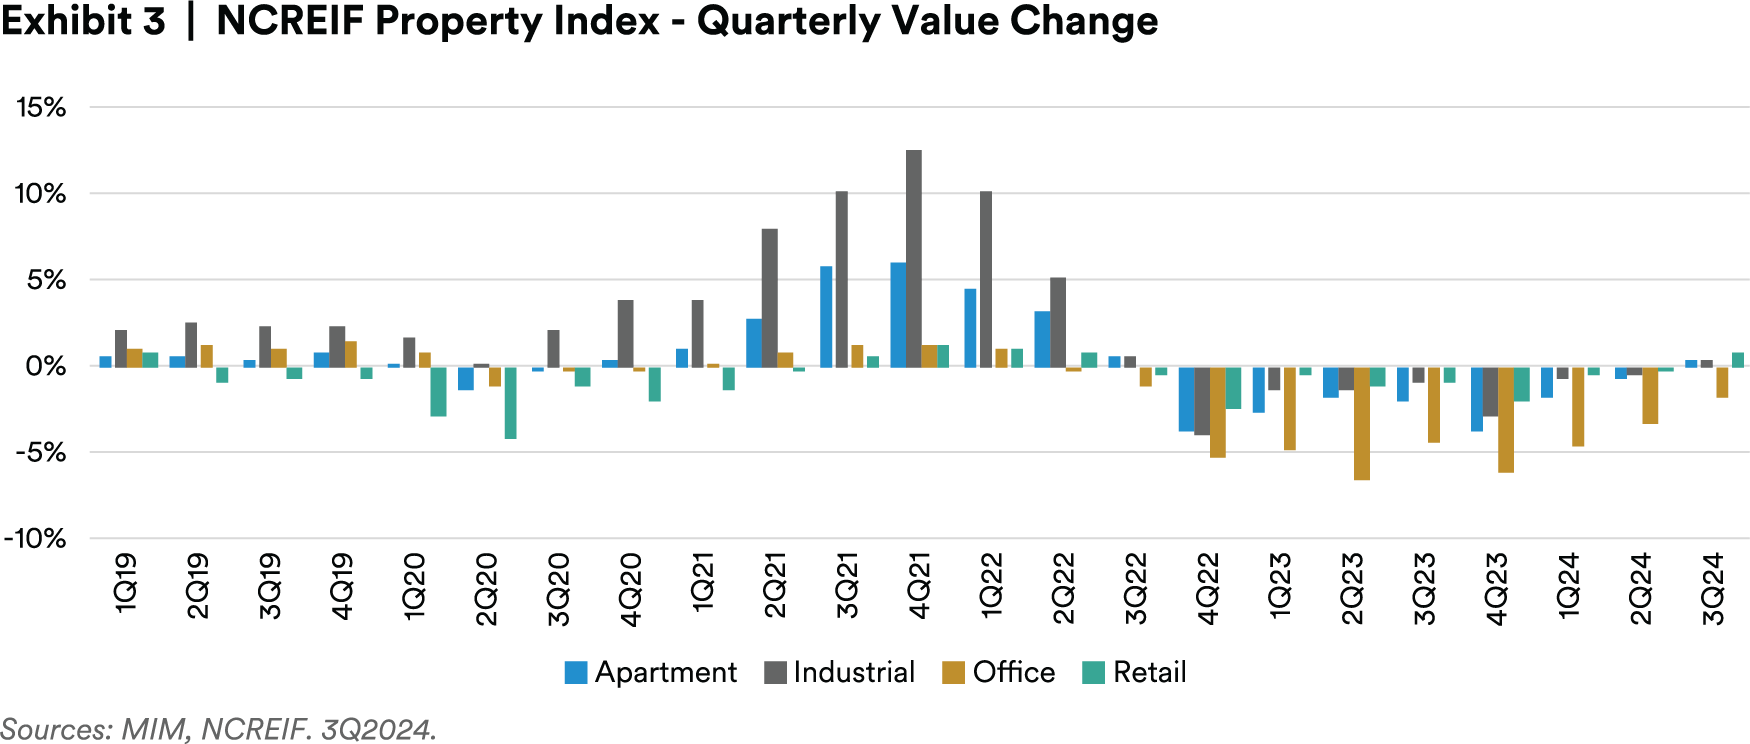
The National Council of Real Estate Investment Fiduciaries (NCREIF) Property Index (NPI) — an appraisal-based index that tends to lag spot markets by several quarters — confirms trends we observed in early 2024. Apartment, retail and industrial value growth turned positive for the first time since 2022 Q3. While office values continued to decline last quarter, the magnitude of declines was the smallest since price declines began (Exhibit 3).
Several indicators lead us to believe that this positive momentum on real estate value growth is durable.
First, an examination of historical trends suggests that positive returns are sticky. Once real estate returns turn positive after a period of declines, it is unlikely they will revert to negative territory. This was the case following the 90s downturn, as well as the period after the financial crisis (Exhibit 4).
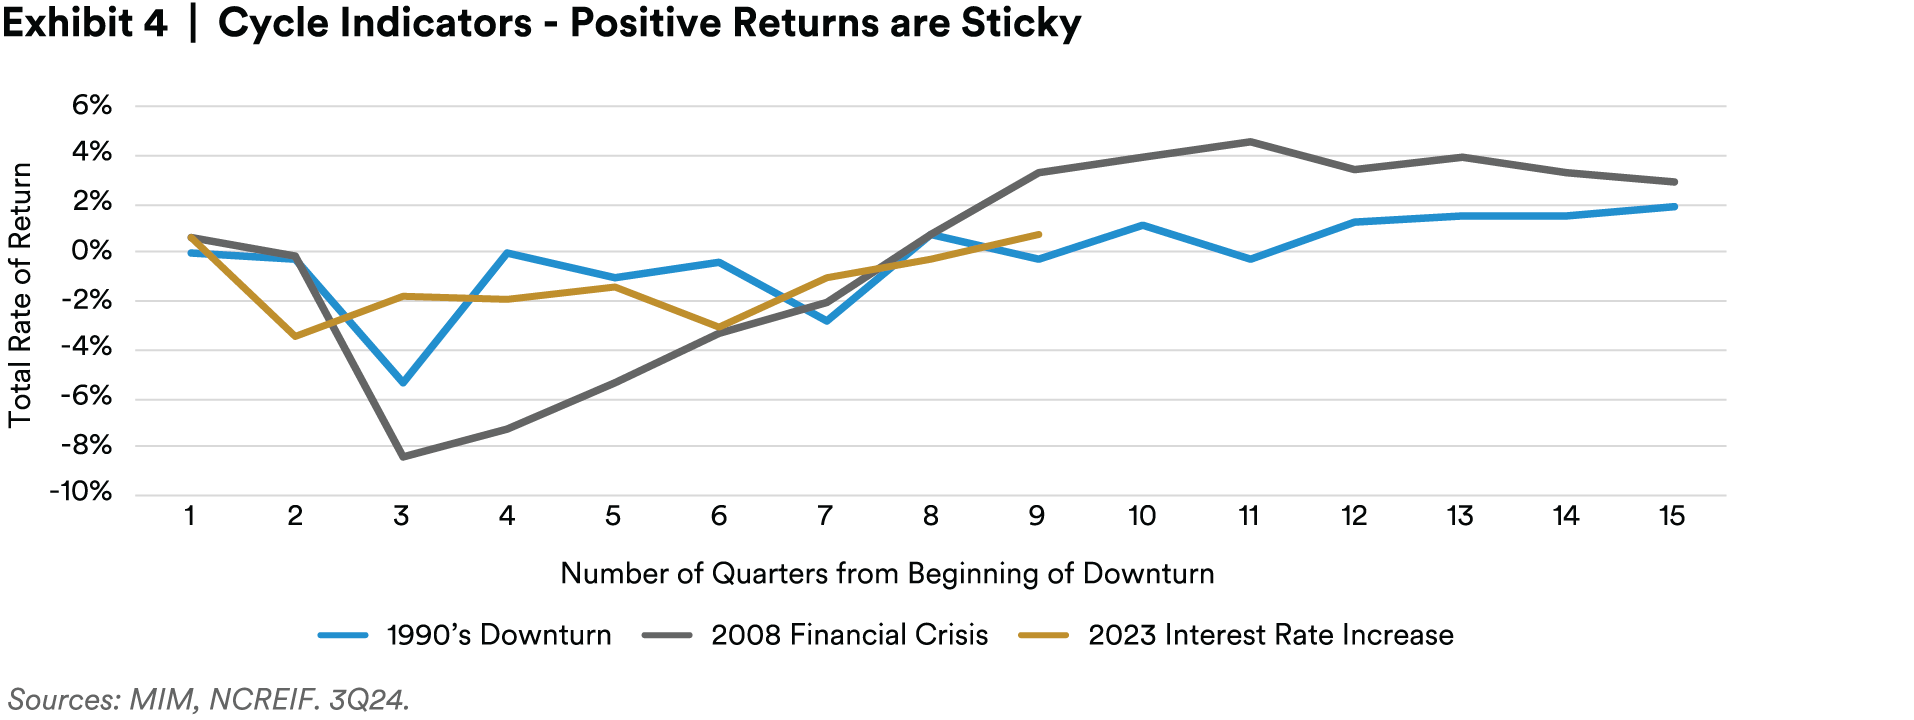
This momentum-like indicator reflects the fact that during a downturn, real estate values often overcorrect. To test this assumption, we can turn to another indicator that offers insight into the likely direction of real estate values: the relationship between real estate prices and inflation.
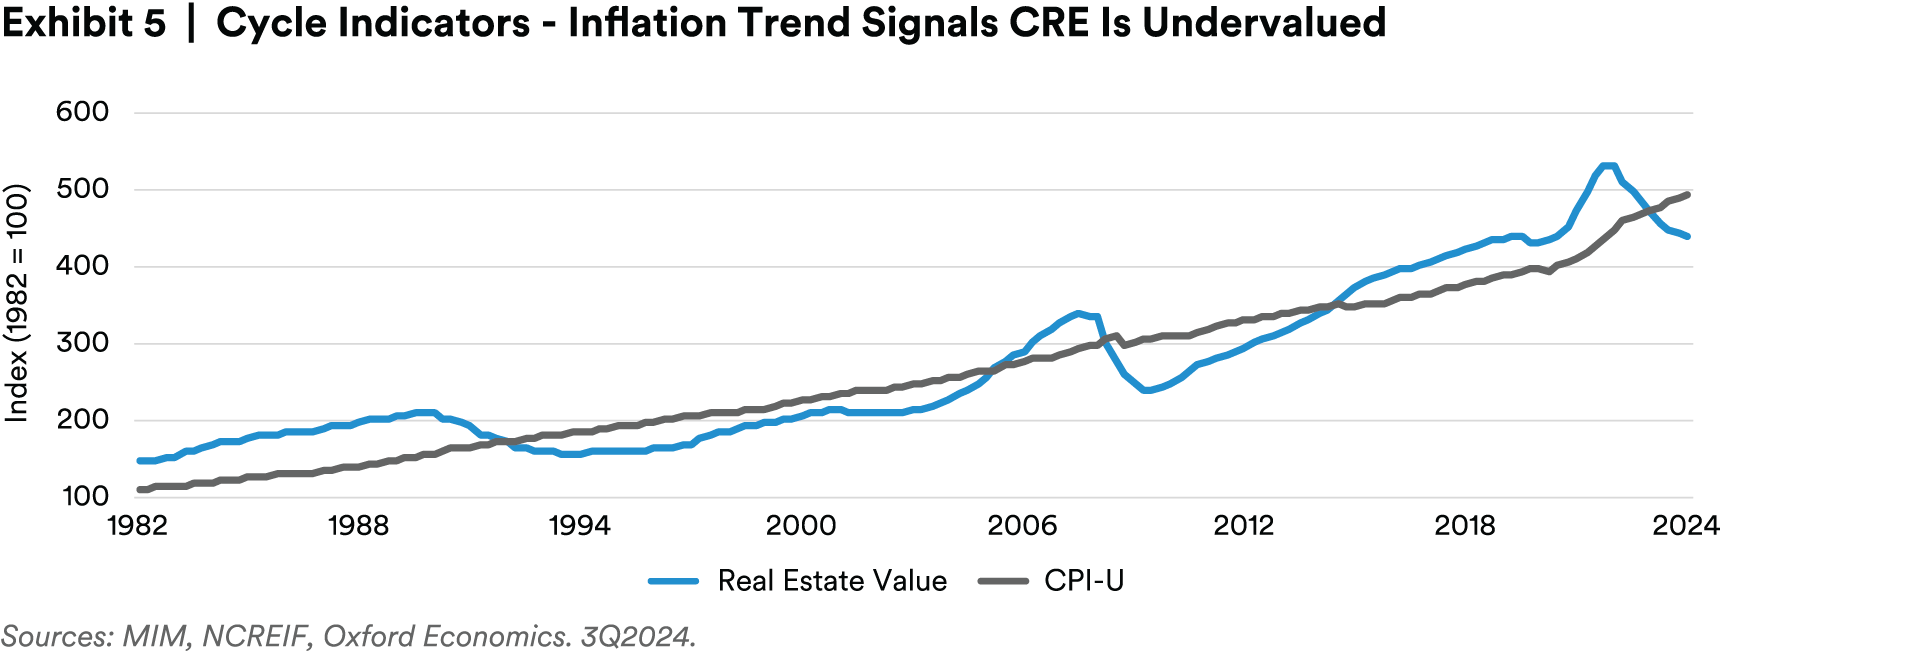
Real estate price changes are almost perfectly correlated with inflation over the very long term. In other words, if adjusted only for inflation, the value of a property in 1980 would be approximately the same as in 2024.
While this is true over long periods, the relationship can break down at various points in a real estate cycle.
We view periods when real estate prices are below their long-term inflation trend line as an added margin of safety — when property prices are more likely to go up than to go down. Similarly, when prices are above their inflation trend, they tend to overcorrect downward. That was the case following the savings and loan crisis in the early 90s, after the global financial crisis, and is the case today (Exhibit 5). Real estate investors entering the market today can purchase assets that are undervalued with respect to this inflation trend.
In addition to these long-term value indicators, there is evidence of positive price momentum in current transaction markets.
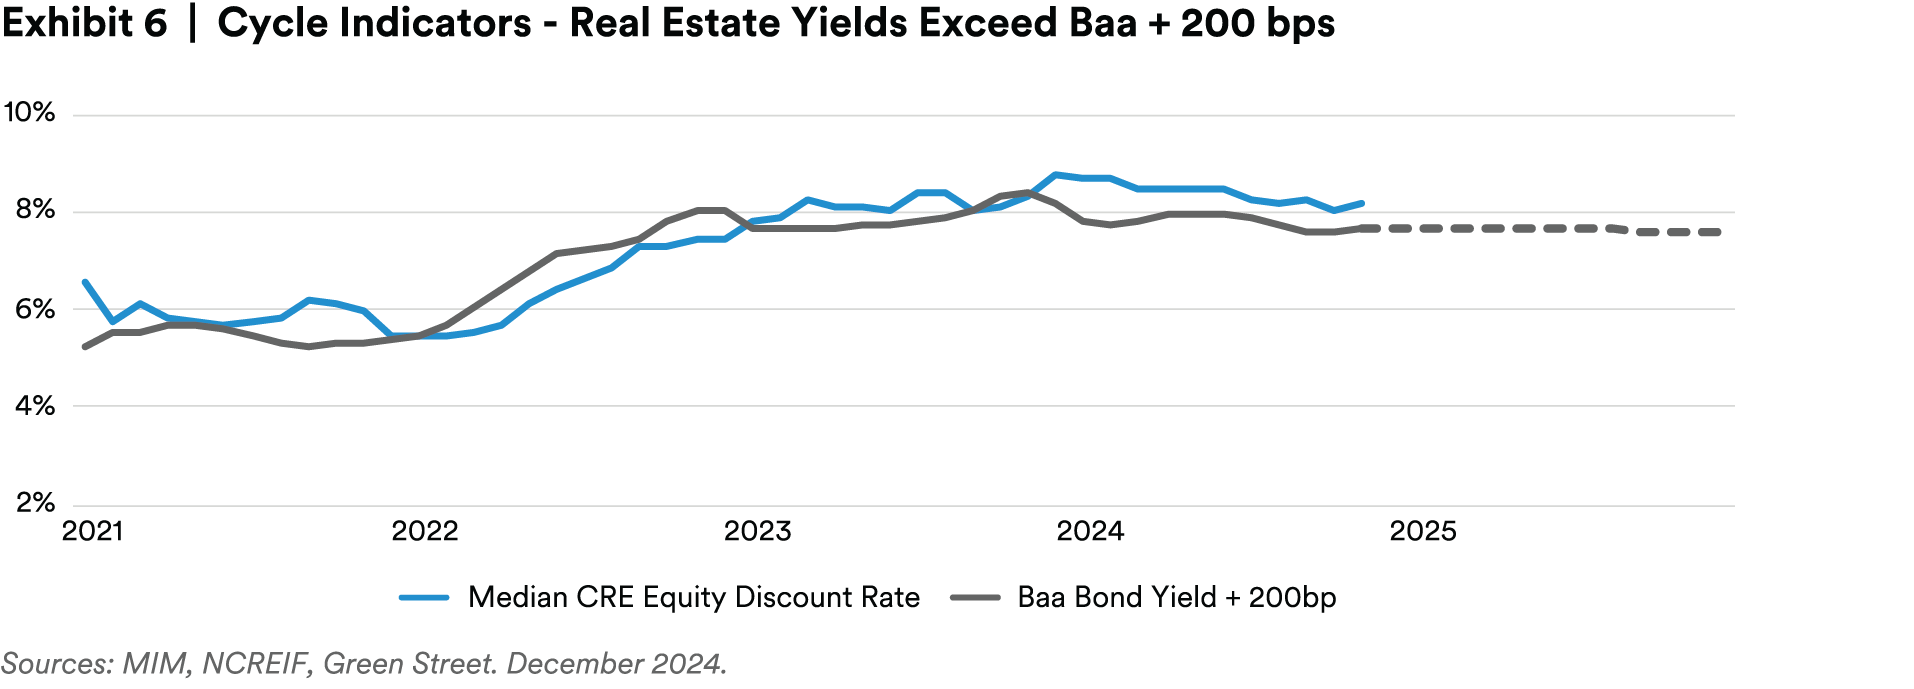
Over a full cycle, real estate equity yields are generally equal to triple B bonds yields plus 200 basis points (bps).1 When yields exceed that threshold, we can say real estate equity is fairly or attractively priced. This can lead to capital flowing into the sector and subsequent upward pressure on values.
Exhibit 6 shows this relationship. The blue line includes underwritten unlevered real estate equity yields for several hundred transactions screened by MIM (but not necessarily won/closed on) over the past several years, and compares those yields to Baa corporates + 200 bps.2
This analysis offered a warning sign in 2022 and 2023 when interest rates began to rise and risk spreads began to widen, which led us to slow our transaction activity.
Today, the opposite is the case. Real estate appears fairly or attractively valued according to this framework. Further, the outlook for flat or modestly lower interest rates implies downward pressure on real estate yields and thus upward pressure on prices.
Last on our list of cycle indicators are data from the public markets.
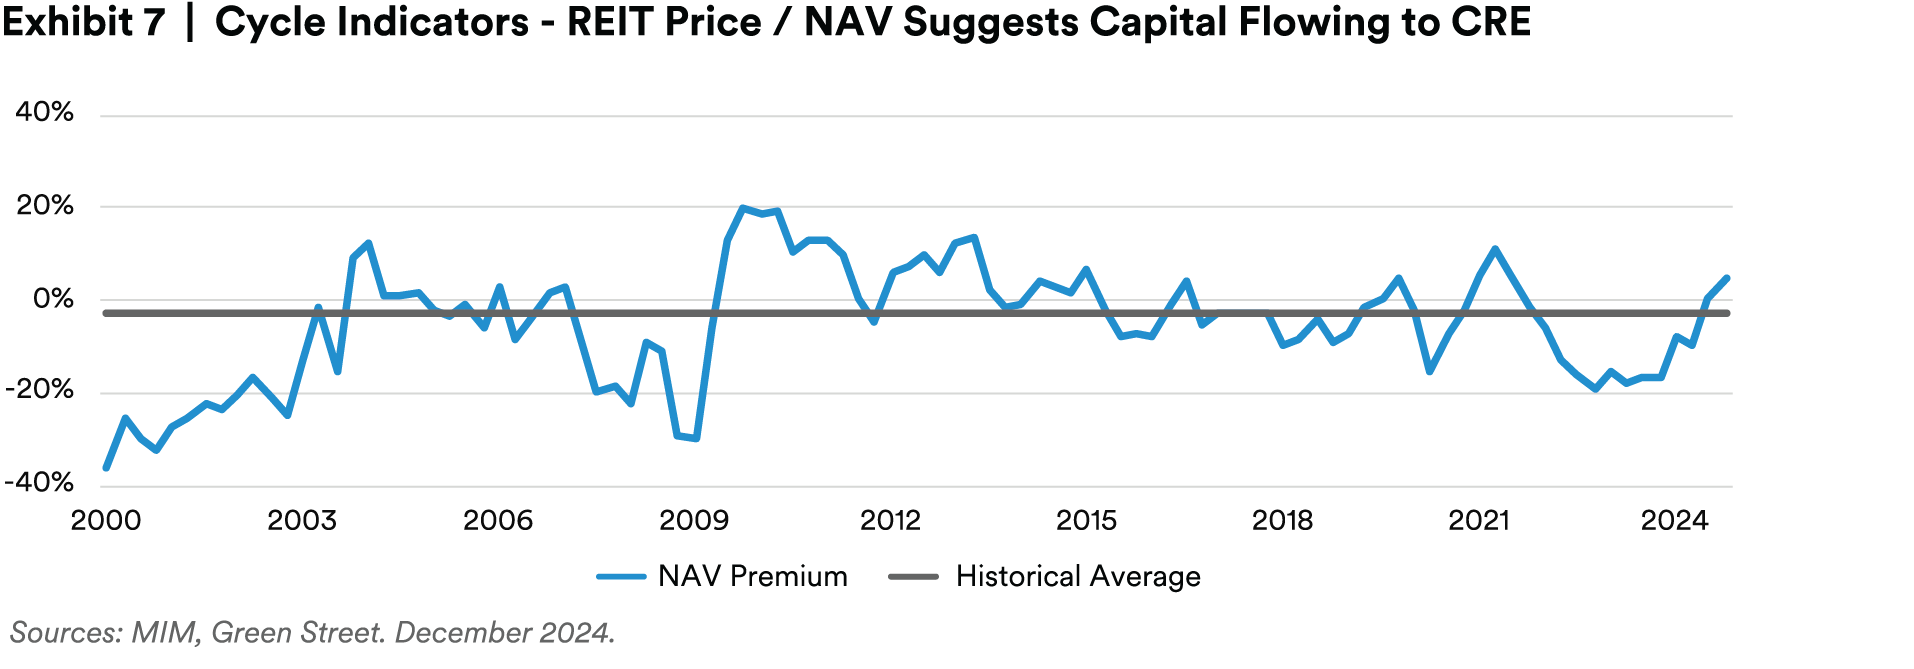
When REIT stocks are trading at a discount to their underlying asset values, it is difficult for those firms to raise capital for acquisitions. This can be a signal of weakening liquidity and pricing for private real estate equity, since a major share of the buyer pool is on the sidelines.
Alternatively, when REITs are trading at or above the value of their assets, they tend to reenter the market, which has a positive impact on prices and transaction volume.
For much of 2022 and 2023, REITs traded at a discount to Net Asset Value, like during the Global Financial Crisis, and are now trading at a slight premium (Exhibit 7).
Early Mover’s Advantage
Identifying when the real estate cycle has turned provides investors with a margin of safety but can also translate into outperformance for early-cycle vintage investments. This window of opportunity can persist for several quarters or even years after the start of a new cycle. Being a first mover is great (to the extent one can perfectly time a cycle) but being early is good, too.
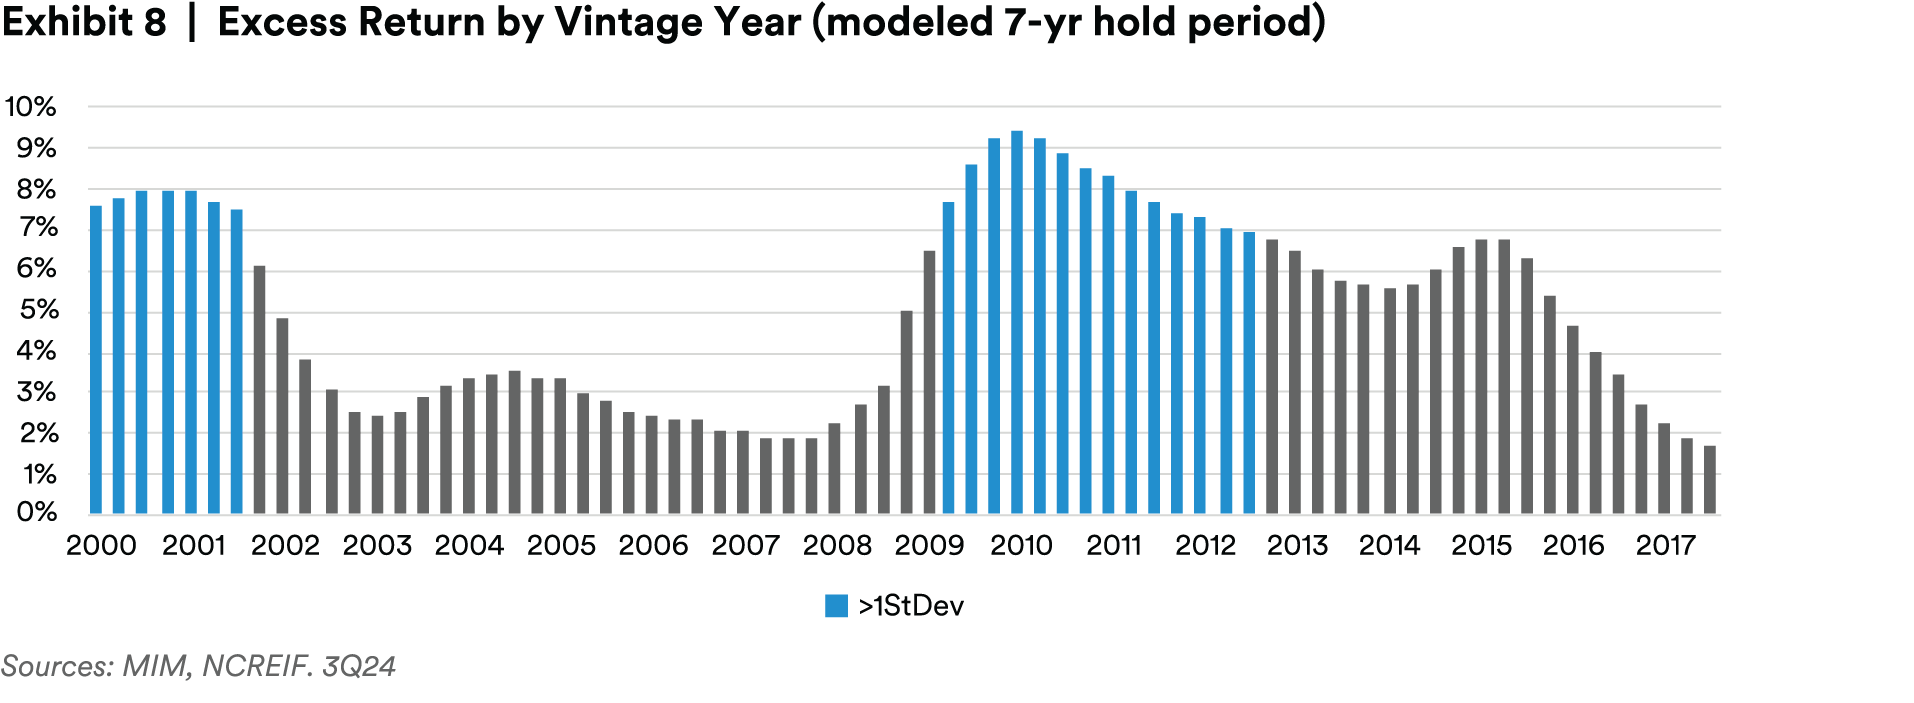
Consider Exhibit 8, which shows modeled seven-year hold period unlevered excess returns by vintage year, going back to 2000.3 The blue bars show periods when excess returns are more than one standard deviation above average.
There are two takeaways from this chart. First, periods following real estate downturns tend to produce higher returns. Second, the optimal investment window is far from fleeting, lasting seven quarters following the dot.com bust, and a full 14 quarters following the GFC.
Property Sector Outlook
While our macro-view on the real estate sector is positive, there are still wide performance divergences across markets and property types that should carry into 2025.
Multifamily and industrial sectors are still contending with pockets of oversupply.
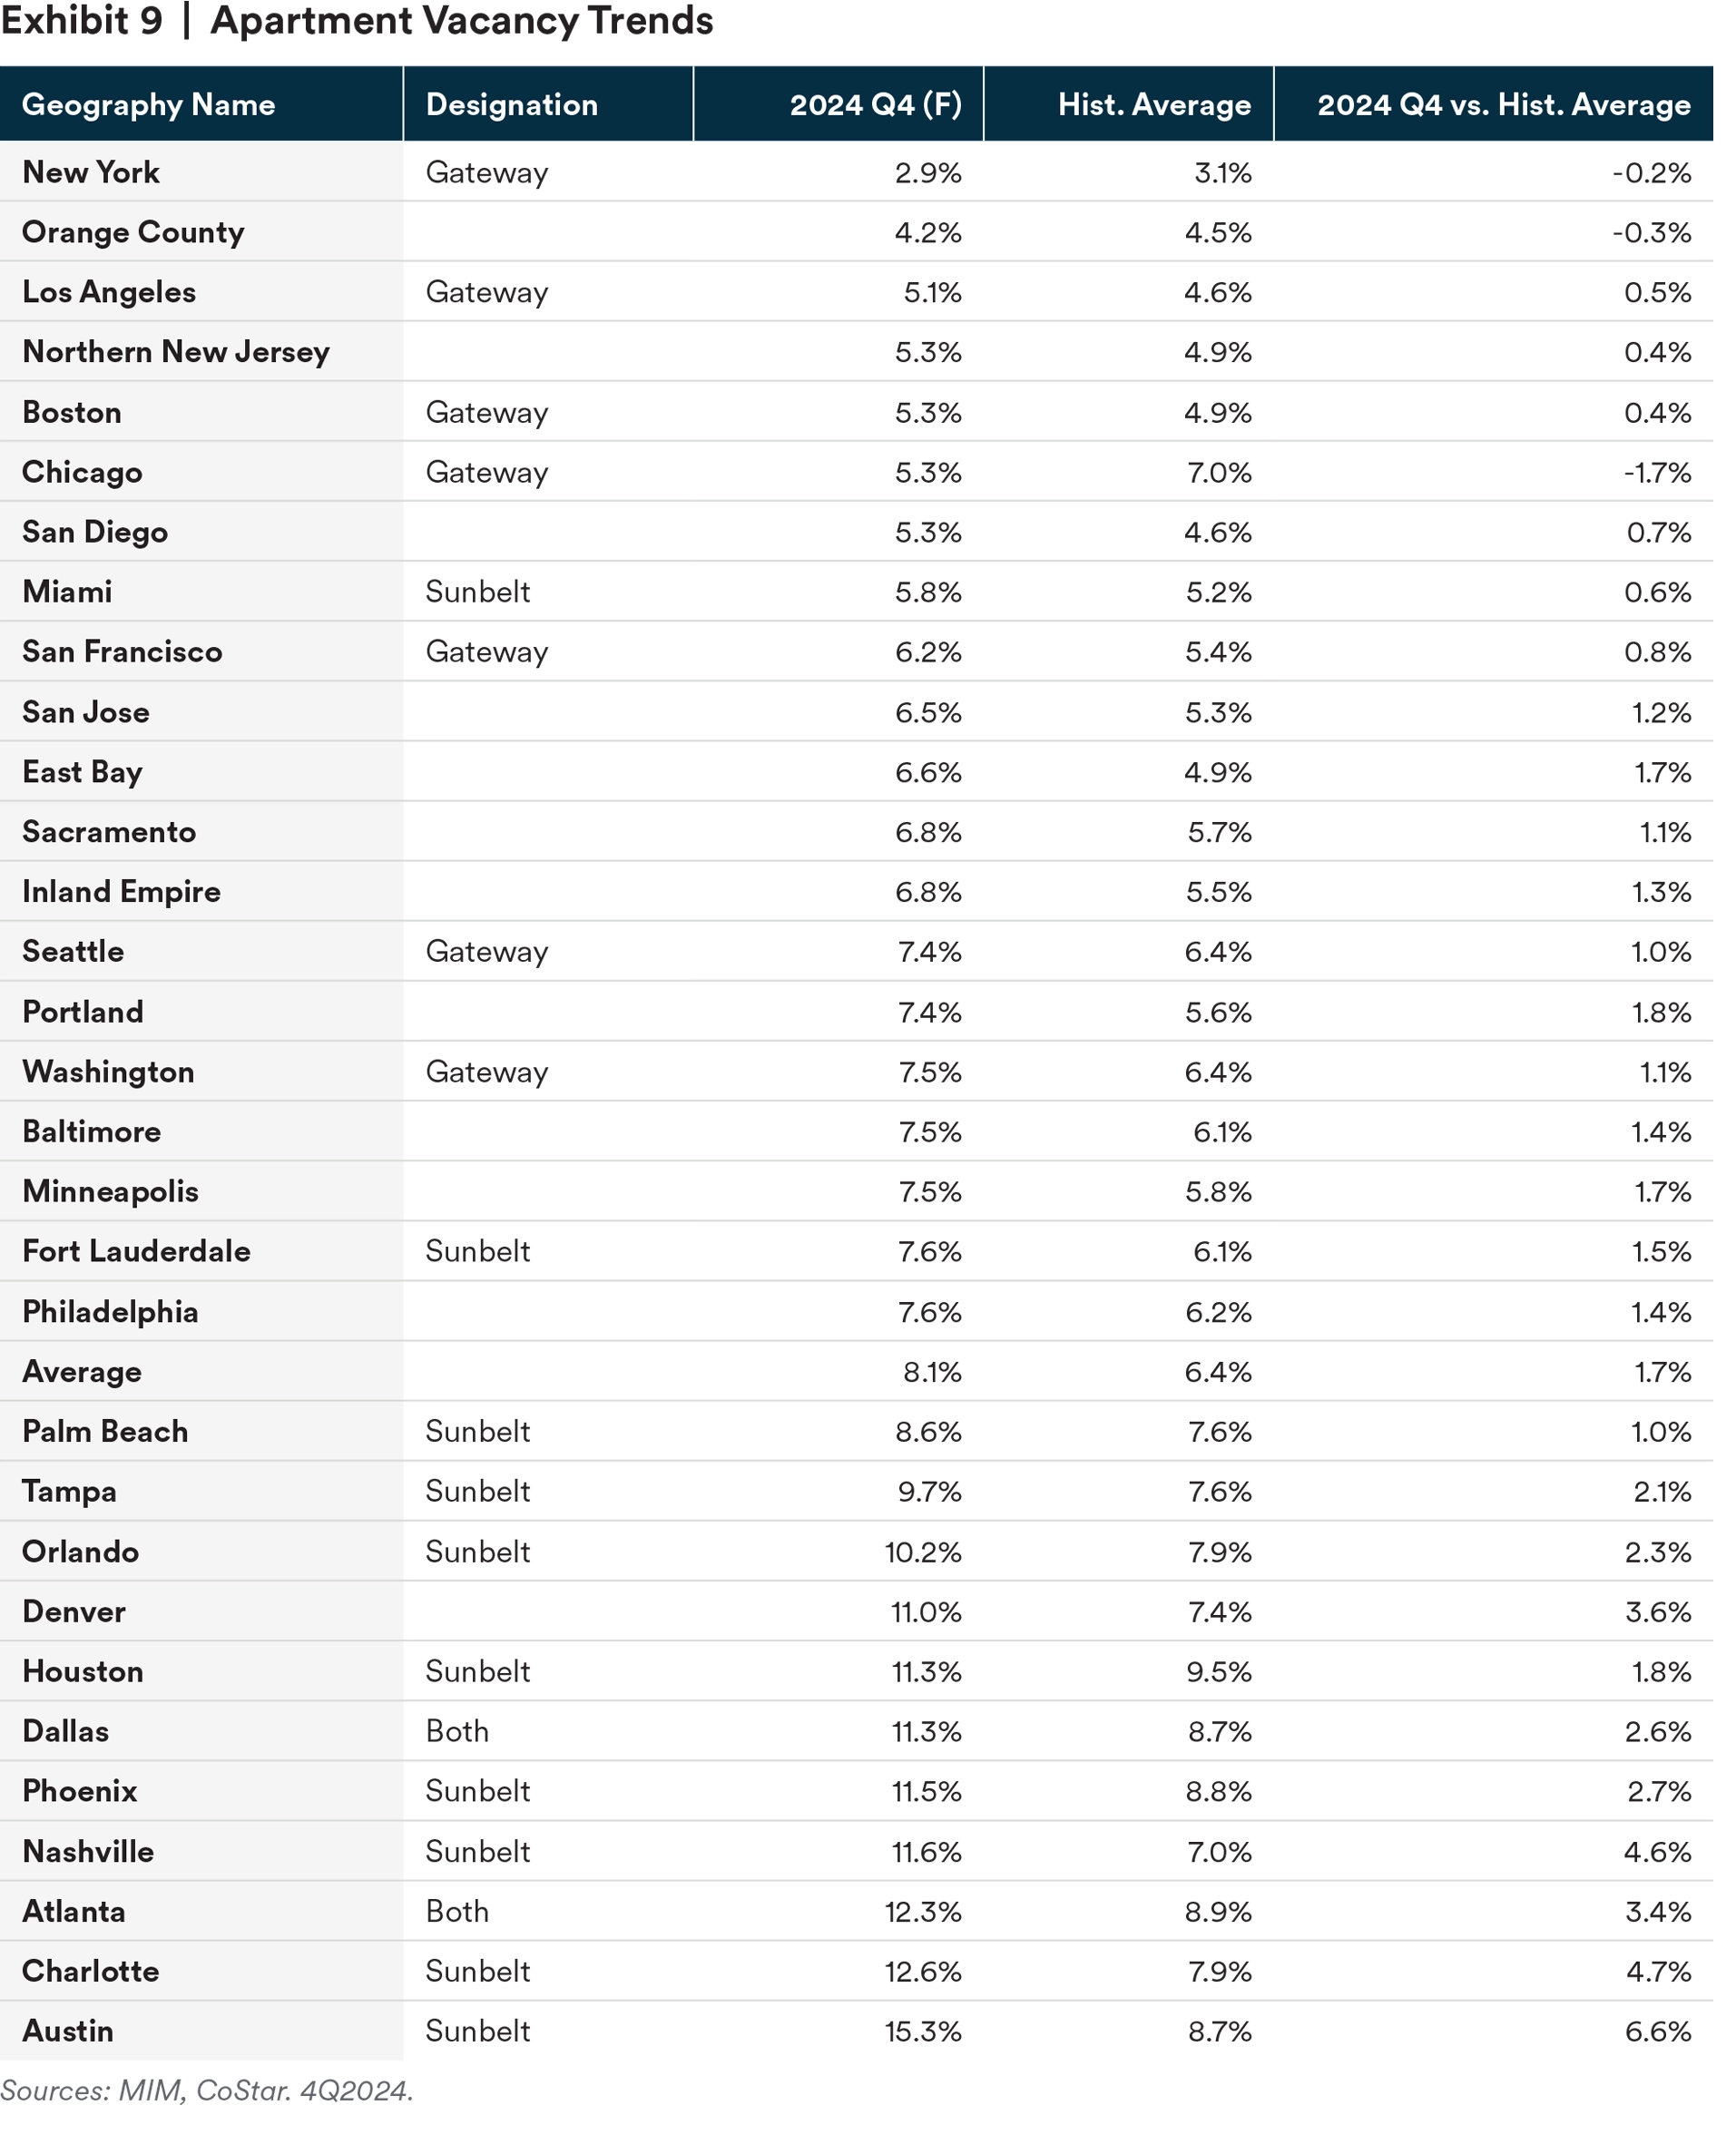
For the multifamily sector, supply pressures are most evident in Sunbelt markets like Austin and Phoenix. The larger coastal or gateway markets like New York and Chicago have seen less new construction and are experiencing stable rent growth (Exhibit 9).
In the industrial sector, performance divergences are more evident across submarkets of metropolitan areas. Vacancy is holding up well for infill sites that support last-mile distribution and where new development is challenging. For regional distribution centers, often over 300,000 square feet and built in less-dense submarkets with fewer supply barriers, vacancy increases have been more pronounced (Exhibit 10).
In both cases though, demand has been stable, and declining construction starts are beginning to alleviate supply pressure on vacancy. The markets and submarkets that outperformed in 2024 will likely also do so in 2025, but we expect the advantage of constrained supply growth to be gone by 2026.

Retail fundamentals are the strongest they have been in quite some time. Vacancy for all retail subtypes outside the troubled mall sector is at the lowest level on record going back over 30 years. Even for malls, vacancy is elevated, but is no longer increasing, and public market Price/NAV signals indicate capital may begin to flow more consistently to the highest-quality assets.
In terms of retail demand, consumers are healthy, and the market has become concentrated with retailers that were strong enough to survive COVID. On the supply side, very little retail has been built over the last 15 years, and there is no prospect of retail construction starts to pick up in the near term. Given these two conditions, we expect healthy rent and income growth for retail in 2025 and expect an increase in institutional investor interest in the sector.
Spotlight on Office
2025 will offer a short window of opportunity, where the best performing office assets in the best markets are “thrown out with the bath water.”
Today, we observe that investors are requiring too similar returns from both trophy4 and commodity office assets, despite the fact that trophy asset performance is on par with industrial or multifamily sectors. We expect pricing for best-quality office assets to be as competitive as pricing for residential and industrial assets by 2026.
In the aggregate, the office sector is still distressed; vacancy is hovering around 19%; and we expect office prices outside the trophy cohort to continue searching for a bottom, possibly into late 2025 or early 2026.
On the positive side, vacancy has now been unchanged for two consecutive quarters and may have peaked. Anecdotally, remote work trends are also stabilizing. A recent survey from KPMG showed 83% of CEO’s expect a full return to office within three years, up from 64% as reported last year. It has also been reported that some of the companies that leaned most heavily into remote work are now pursuing stringent return-to-office policies.5
If vacancy remains flat or begins to recede in 2025 (which is our base case), the peak in office vacancy will be slightly less severe and occur earlier than market expectations (Exhibit 11).

There are also several U.S. cities where office fundamentals have returned to normal. These are markets that have benefited from strong population growth in recent years, which has helped offset remote-work-related headwinds. Miami is one example where the office vacancy rate is now below its historical average.
Alternatively, Core.
What’s in a name? Both Juliet in Romeo and Juliet, and Timon in The Lion King, would agree that an object’s name doesn’t dictate its essence — advice that real estate investors may finally be heeding.
The naming of property types as “core” or “alternative” has been ongoing at least since the founding of NCREIF in the early 1980s, as highlighted in last year's insight, Gateway Markets and Core Property Types: Not What They Used to Be, and has influenced investment strategies, capital flows and pricing ever since.
Historically, “core” implied properties with stable, predictable cash flows. Property types originally included office, industrial and malls, and in the early 1990s, the definition of “core” was expanded to include apartments. Because these property types were so large, they were the only ones that had a semblance of transparency, which made the risk profile seem lower (or at least understandable).
Leaning on more abundant high-quality data in several “alternative” property types, NCREIF revised definitions around property types and specifications on their inclusion in core funds in 2024. We think this change will accelerate capital flows to several sectors in 2025 and beyond.
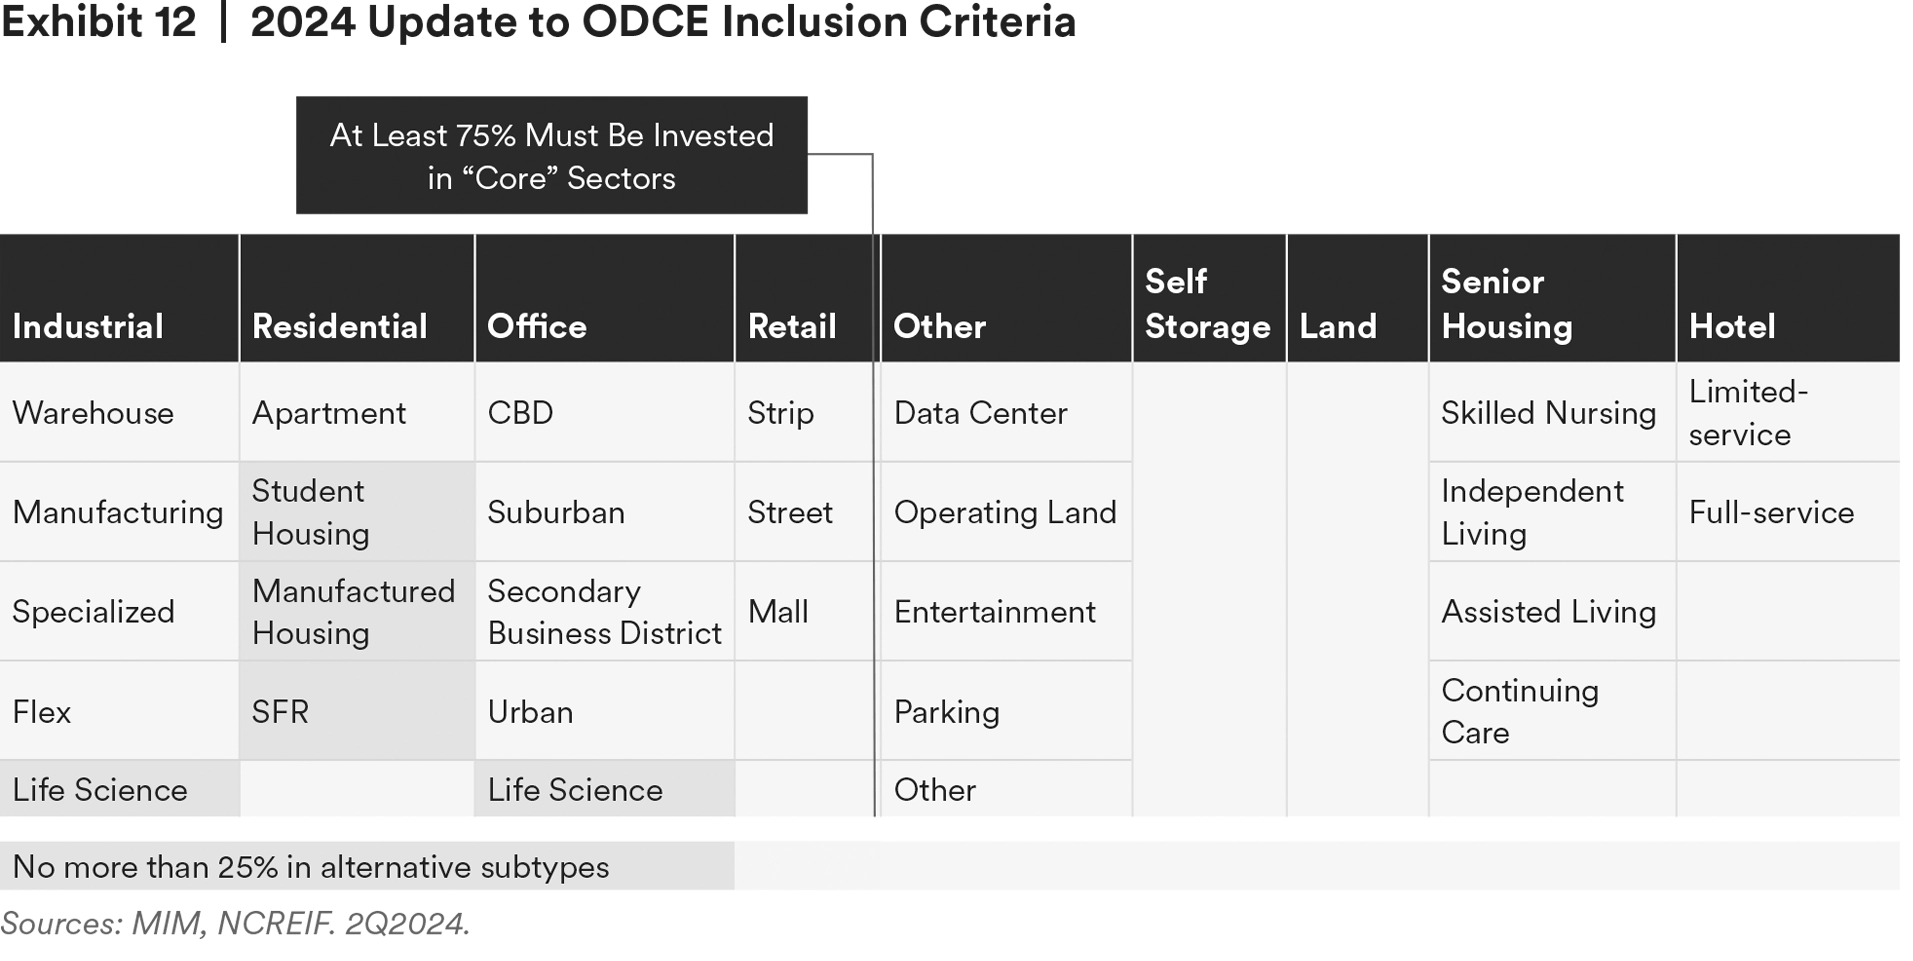
Among the “core” property types, the apartment sector is now more broadly defined as residential and includes subindices such as manufactured housing, student housing and single-family rental. The office and industrial categories were broadened to include a bucket for life science. Outside the “core” property types, NCREIF increased the allowable allocation to sectors like hotels and parking garages, among others, from 20% to 25%.
Given the new inclusion criteria, an ODCE fund could theoretically have up to 50% of the portfolio allocated to what were historically considered alternative property types (25% in non-core property types and 25% in newly created subtypes of core property types).
This serves two key functions for real estate investors.
First, it widens the pool of opportunities available to ODCE fund managers and signals what a “market” core portfolio could look like for non-ODCE members. This is especially important given the challenges the mall and office sectors (which traditionally accounted for a large share of core portfolios) have faced in recent years. Second, as we outlined in ODCE Adopts an Alternative Approach, this change should also benefit risk-adjusted returns by offering the potential to increase sector diversification within real estate funds and lower portfolio volatility.
Looking to the years ahead, we think “alternative” property types’ share of the private real estate market (using NCREIF ODCE as a benchmark) will rise from around 13% today to around 30% ten years from now (and 3% in 2010).
We expect alternative housing sectors such as seniors, single-family rentals or manufactured housing, technology sectors such as data or life science, and self-storage will gain share. We expect most of the shift out of “old core” sectors to come from office. Office exposure was 36% of the index in 2010, is now just under 20%, and could fall to around 10% over the next 10 years, in our view. Office was falling out of favor even prior to the work-from-home revolution because of high capital expenditure needs and slowing demand growth. More details on MIM’s property type ranking across core and alternative sectors can be found in the latest Quarterly Real Estate Chartbook.
Conclusion
The commercial real estate cycle is seemingly at a tipping point between the challenges of the past several years and the opportunities that lie ahead.
Several indicators are showing we are in the early stages of a new real estate cycle that we began to observe last year. These include appraisal data from NCREIF, the relationship between real estate prices and inflation, and public market indicators like bond and REIT pricing.
In general, we think the next year could look a lot like the last year, something we haven’t been able to say in quite some time. 2025 should be characterized by continued mending in real estate pricing and transaction activity. Performance divergences persist across property types, but we think most real estate supply and demand trends are directionally positive, including in the office sector.
Historically, investors have been rewarded for making investments near the start of a new real estate cycle. We expect 2025 to be an outperforming vintage for many property types, and across the capital stack.
Endnotes
1 MIM, NCREIF, Green Street. December 2024.
2 MIM. Includes underwritten core stabilized transactions screened by MIM but not necessarily closed on. 2021 – December 2024.
3 MIM, NCREIF. Excess return of seven-year forward unlevered NPI returns over 10-year Treasury.
4 We characterize trophy assets as 2015+ vintage properties, with high-end finishes, amenities, floor-to-ceiling windows, etc., that are in the best markets and submarkets.
5 https://www.wsj.com/lifestyle/workplace/amazon-return-to-office-five-day-policy-1cf0c496
Disclaimer
This material is intended solely for Institutional Investors, Qualified Investors and Professional Investors. This analysis is not intended for distribution with Retail Investors.
This document has been prepared by MetLife Investment Management (“MIM”)1 solely for informational purposes and does not constitute a recommendation regarding any investments or the provision of any investment advice, or constitute or form part of any advertisement of, offer for sale or subscription of, solicitation or invitation of any offer or recommendation to purchase or subscribe for any securities or investment advisory services. The views expressed herein are solely those of MIM and do not necessarily reflect, nor are they necessarily consistent with, the views held by, or the forecasts utilized by, the entities within the MetLife enterprise that provide insurance products, annuities and employee benefit programs. The information and opinions presented or contained in this document are provided as of the date it was written. It should be understood that subsequent developments may materially affect the information contained in this document, which none of MIM, its affiliates, advisors or representatives are under an obligation to update, revise or affirm. It is not MIM’s intention to provide, and you may not rely on this document as providing, a recommendation with respect to any particular investment strategy or investment. Affiliates of MIM may perform services for, solicit business from, hold long or short positions in, or otherwise be interested in the investments (including derivatives) of any company mentioned herein. This document may contain forward-looking statements, as well as predictions, projections and forecasts of the economy or economic trends of the markets, which are not necessarily indicative of the future. Any or all forward-looking statements, as well as those included in any other material discussed at the presentation, may turn out to be wrong.
All investments involve risks including the potential for loss of principle and past performance does not guarantee similar future results. Property is a specialist sector that may be less liquid and produce more volatile performance than an investment in other investment sectors. The value of capital and income will fluctuate as property values and rental income rise and fall. The valuation of property is generally a matter of the valuers’ opinion rather than fact. The amount raised when a property is sold may be less than the valuation. Furthermore, certain investments in mortgages, real estate or non-publicly traded securities and private debt instruments have a limited number of potential purchasers and sellers. This factor may have the effect of limiting the availability of these investments for purchase and may also limit the ability to sell such investments at their fair market value in response to changes in the economy or the financial markets.
In the U.S.: This document is communicated by MetLife Investment Management, LLC (MIM, LLC), a U.S. Securities Exchange Commission registered investment adviser. MIM, LLC is a subsidiary of MetLife, Inc. and part of MetLife Investment Management. Registration with the SEC does not imply a certain level of skill or that the SEC has endorsed the investment advisor.
For investors in the UK: This document is being distributed by MetLife Investment Management Limited (“MIML”), authorised and regulated by the UK Financial Conduct Authority (FCA reference number 623761), registered address One Angel Lane 8th Floor London EC4R 3AB United Kingdom. This document is approved by MIML as a financial promotion for distribution in the UK. This document is only intended for, and may only be distributed to, investors in the UK who qualify as a "professional client" as defined under the Markets in Financial Instruments Directive (2014/65/EU), as per the retained EU law version of the same in the UK.
For investors in the Middle East: This document is directed at and intended for institutional investors (as such term is defined in the various jurisdictions) only. The recipient of this document acknowledges that (1) no regulator or governmental authority in the Gulf Cooperation Council (“GCC”) or the Middle East has reviewed or approved this document or the substance contained within it, (2) this document is not for general circulation in the GCC or the Middle East and is provided on a confidential basis to the addressee only, (3) MetLife Investment Management is not licensed or regulated by any regulatory or governmental authority in the Middle East or the GCC, and (4) this document does not constitute or form part of any investment advice or solicitation of investment products in the GCC or Middle East or in any jurisdiction in which the provision of investment advice or any solicitation would be unlawful under the securities laws of such jurisdiction (and this document is therefore not construed as such).
For investors in Japan: This document is being distributed by MetLife Investment Management Japan, Ltd. (“MIM JAPAN”), a registered Financial Instruments Business Operator (“FIBO”) conducting Investment Advisory Business, Investment Management Business and Type II Financial Instruments Business under the registration entry “Director General of the Kanto Local Finance Bureau (Financial Instruments Business Operator) No. 2414” pursuant to the Financial Instruments and Exchange Act of Japan (“FIEA”), and a regular member of the Japan Investment Advisers Association and the Type II Financial Instruments Firms Association of Japan. In its capacity as a discretionary investment manager registered under the FIEA, MIM JAPAN provides investment management services and also sub-delegates a part of its investment management authority to other foreign investment management entities within MIM in accordance with the FIEA. This document is only being provided to investors who are general employees' pension fund based in Japan, business owners who implement defined benefit corporate pension, etc. and Qualified Institutional Investors domiciled in Japan. It is the responsibility of each prospective investor to satisfy themselves as to full compliance with the applicable laws and regulations of any relevant territory, including obtaining any requisite governmental or other consent and observing any other formality presented in such territory. As fees to be borne by investors vary depending upon circumstances such as products, services, investment period and market conditions, the total amount nor the calculation methods cannot be disclosed in advance. All investments involve risks including the potential for loss of principle and past performance does not guarantee similar future results. Investors should obtain and read the prospectus and/or document set forth in Article 37-3 of Financial Instruments and Exchange Act carefully before making the investments.
For Investors in Hong Kong S.A.R.: This document is being issued by MetLife Investments Asia Limited (“MIAL”), a part of MIM, and it has not been reviewed by the Securities and Futures Commission of Hong Kong (“SFC”). MIAL is licensed by the Securities and Futures Commission for Type 1 (dealing in securities), Type 4 (advising on securities) and Type 9 (asset management) regulated activities.
For investors in Australia: This information is distributed by MIM LLC and is intended for “wholesale clients” as defined in section 761G of the Corporations Act 2001 (Cth) (the Act). MIM LLC exempt from the requirement to hold an Australian financial services license under the Act in respect of the financial services it provides to Australian clients. MIM LLC is regulated by the SEC under US law, which is different from Australian law.
For investors in the EEA: This document is being distributed by MetLife Investment Management Europe Limited (“MIMEL”), authorised and regulated by the Central Bank of Ireland (registered number: C451684), registered address 20 on Hatch, Lower Hatch Street, Dublin 2, Ireland. This document is approved by MIMEL as marketing communications for the purposes of the EU Directive 2014/65/EU on markets in financial instruments (“MiFID II”). Where MIMEL does not have an applicable cross-border licence, this document is only intended for, and may only be distributed on request to, investors in the EEA who qualify as a “professional client” as defined under MiFID II, as implemented in the relevant EEA jurisdiction. The investment strategies described herein are directly managed by delegate investment manager affiliates of MIMEL. Unless otherwise stated, none of the authors of this article, interviewees or referenced individuals are directly contracted with MIMEL or are regulated in Ireland. Unless otherwise stated, any industry awards referenced herein relate to the awards of affiliates of MIMEL and not to awards of MIMEL.
1 As of July 22, 2024, subsidiaries of MetLife, Inc. that provide investment management services to MetLife’s general account, separate accounts and/or unaffiliated/third party investors include Metropolitan Life Insurance Company, MetLife Investment Management, LLC, MetLife Investment Management Limited, MetLife Investments Limited, MetLife Investments Asia Limited, MetLife Latin America Asesorias e Inversiones Limitada, MetLife Investment Management Japan, Ltd., MIM I LLC, MetLife Investment Management Europe Limited and Affirmative Investment Management Partners Limited
2 Source: Pensions & Investments Managers Ranked by Total Worldwide Institutional Assets Under Management as of December 31, 2023.


